Page 6 - FINAL CFA I SLIDES JUNE 2019 DAY 4
P. 6

Session Unit 3:
                                                                                                           12. Hypothesis Testing


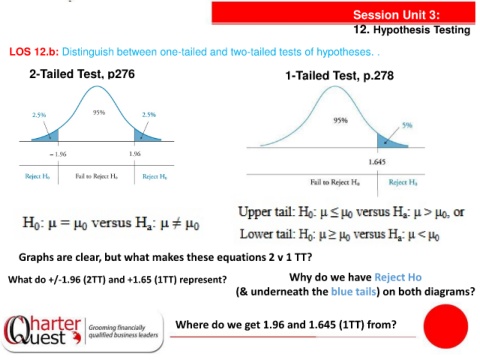
    LOS 12.b: Distinguish between one-tailed and two-tailed tests of hypotheses. .


          2-Tailed Test, p276                                                          1-Tailed Test, p.278


       Graphs are clear, but what makes these equations 2 v 1 TT?


   What do +/-1.96 (2TT) and +1.65 (1TT) represent?                                     Why do we have Reject Ho
                                                                        (& underneath the blue tails) on both diagrams?


                                                      Where do we get 1.96 and 1.645 (1TT) from?
   1   2   3   4   5   6   7   8   9   10   11