
Page 22 - PowerPoint Presentation
P. 22
THE F-STATISTIC MODULE 7.5: ANOVA TABLES, R , AND SEE
2
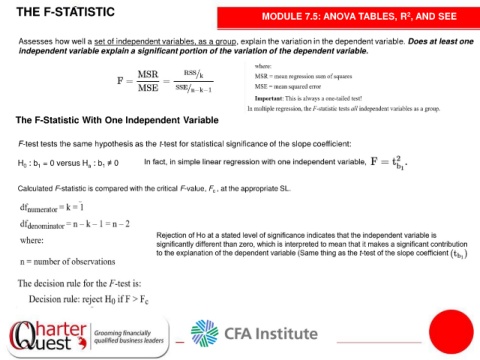
Assesses how well a set of independent variables, as a group, explain the variation in the dependent variable. Does at least one
independent variable explain a significant portion of the variation of the dependent variable.
The F-Statistic With One Independent Variable
F-test tests the same hypothesis as the t-test for statistical significance of the slope coefficient:
H : b = 0 versus H : b ≠ 0
a
1
0
1
Calculated F-statistic is compared with the critical F-value, F , at the appropriate SL.
c