
Page 23 - PowerPoint Presentation
P. 23
2
MODULE 7.5: ANOVA TABLES, R , AND SEE
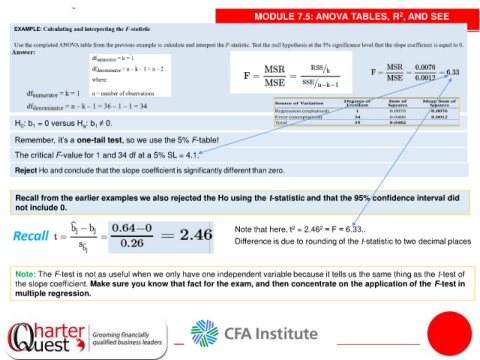
H : b = 0 versus H : b ≠ 0.
1
0
1
a
Remember, it’s a one-tail test, so we use the 5% F-table!
The critical F-value for 1 and 34 df at a 5% SL = 4.1.
Reject Ho and conclude that the slope coefficient is significantly different than zero.
Recall from the earlier examples we also rejected the Ho using the t-statistic and that the 95% confidence interval did
not include 0.
2
Note that here, t = 2.46 ≈ F = 6.33..
2
Difference is due to rounding of the t-statistic to two decimal places
Note: The F-test is not as useful when we only have one independent variable because it tells us the same thing as the t-test of
the slope coefficient. Make sure you know that fact for the exam, and then concentrate on the application of the F-test in
multiple regression.