
Page 29 - PowerPoint Presentation
P. 29
READING 8: MULTIPLE REGRESSION AND ISSUES IN REGRESSION ANALYSIS
Lets return to LOS 8b: p-values
MODULE 8.2: HYPOTHESIS TESTS AND CONFIDENCE INTERVALS
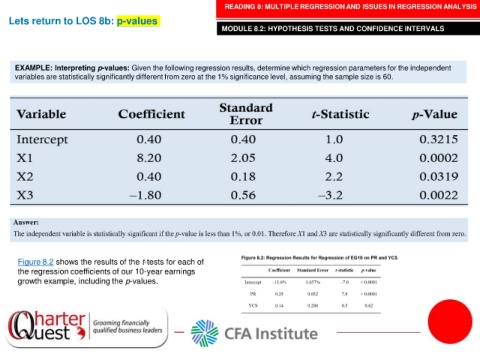
EXAMPLE: Interpreting p-values: Given the following regression results, determine which regression parameters for the independent
variables are statistically significantly different from zero at the 1% significance level, assuming the sample size is 60.
Figure 8.2 shows the results of the t-tests for each of
the regression coefficients of our 10-year earnings
growth example, including the p-values.