
Page 41 - PowerPoint Presentation
P. 41
LOS 8.h: Distinguish between and interpret the READING 8: MULTIPLE REGRESSION AND ISSUES IN REGRESSION ANALYSIS
2
2
R and adjusted R in multiple regression.
MODULE 8.4: COEFFICIENT OF DETERMINATION & ADJUSTED R-SQUARED
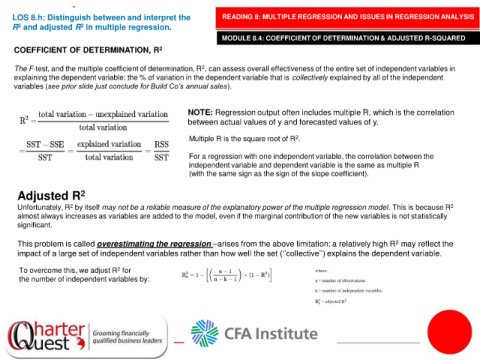
COEFFICIENT OF DETERMINATION, R 2
2
The F-test, and the multiple coefficient of determination, R , can assess overall effectiveness of the entire set of independent variables in
explaining the dependent variable: the % of variation in the dependent variable that is collectively explained by all of the independent
variables (see prior slide just conclude for Build Co’s annual sales).
NOTE: Regression output often includes multiple R, which is the correlation
between actual values of y and forecasted values of y.
Multiple R is the square root of R .
2
For a regression with one independent variable, the correlation between the
independent variable and dependent variable is the same as multiple R
(with the same sign as the sign of the slope coefficient).
Adjusted R 2
Unfortunately, R by itself may not be a reliable measure of the explanatory power of the multiple regression model. This is because R 2
2
almost always increases as variables are added to the model, even if the marginal contribution of the new variables is not statistically
significant.
This problem is called overestimating the regression –arises from the above limitation: a relatively high R may reflect the
2
impact of a large set of independent variables rather than how well the set (‘’collective’’) explains the dependent variable.
To overcome this, we adjust R for
2
the number of independent variables by: