
Page 11 - FINAL CFA II SLIDES JUNE 2019 DAY 3
P. 11
LOS 8.g: Calculate and interpret the F- READING 8: MULTIPLE REGRESSION AND ISSUES IN REGRESSION ANALYSIS
statistic, and describe how it is used in
regression analysis. MODULE 8.3: ANOVA AND THE F-TEST
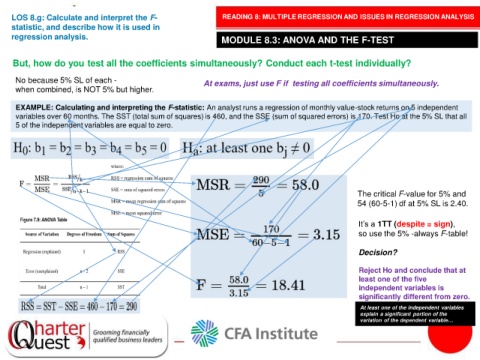
But, how do you test all the coefficients simultaneously? Conduct each t-test individually?
No because 5% SL of each - At exams, just use F if testing all coefficients simultaneously.
when combined, is NOT 5% but higher.
EXAMPLE: Calculating and interpreting the F-statistic: An analyst runs a regression of monthly value-stock returns on 5 independent
variables over 60 months. The SST (total sum of squares) is 460, and the SSE (sum of squared errors) is 170. Test Ho at the 5% SL that all
5 of the independent variables are equal to zero.
The critical F-value for 5% and
54 (60-5-1) df at 5% SL is 2.40.
It’s a 1TT (despite = sign),
so use the 5% -always F-table!
Decision?
Reject Ho and conclude that at
least one of the five
independent variables is
significantly different from zero.
At least one of the independent variables
explain a significant portion of the
variation of the dependent variable…