
Page 7 - FINAL CFA II SLIDES JUNE 2019 DAY 3
P. 7
READING 8: MULTIPLE REGRESSION AND ISSUES IN REGRESSION ANALYSIS
Lets return to LOS 8b: p-values
MODULE 8.2: HYPOTHESIS TESTS AND CONFIDENCE INTERVALS
Other Tests of the Regression Coefficients
How about cases other than Ho = 0 (e.g. Ho = 2, or Ho ≤≥ 2)?
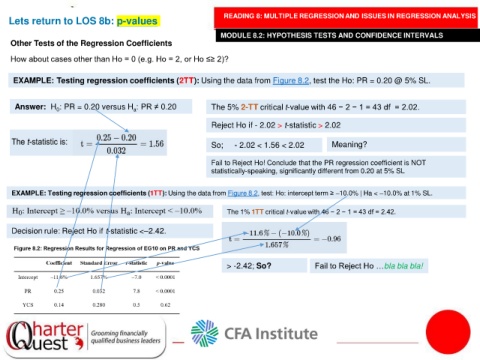
EXAMPLE: Testing regression coefficients (2TT): Using the data from Figure 8.2, test the Ho: PR = 0.20 @ 5% SL.
Answer: H : PR = 0.20 versus H : PR ≠ 0.20 The 5% 2-TT critical t-value with 46 − 2 − 1 = 43 df = 2.02.
a
0
Reject Ho if - 2.02 > t-statistic > 2.02
So; - 2.02 < 1.56 < 2.02 Meaning?
Fail to Reject Ho! Conclude that the PR regression coefficient is NOT
statistically-speaking, significantly different from 0.20 at 5% SL
EXAMPLE: Testing regression coefficients (1TT): Using the data from Figure 8.2, test: Ho: intercept term ≥ –10.0% | Ha < –10.0% at 1% SL.
The 1% 1TT critical t-value with 46 − 2 − 1 = 43 df = 2.42.
Decision rule: Reject Ho if t-statistic <–2.42.
> -2.42; So? Fail to Reject Ho …bla bla bla!