
Page 5 - FINAL CFA II SLIDES JUNE 2019 DAY 3
P. 5
LOS 8.b: Interpret estimated regression coefficients and their p-values
READING 8: MULTIPLE REGRESSION AND ISSUES IN REGRESSION ANALYSIS
Recap from CFA Level I on p value! MODULE 8.2: HYPOTHESIS TESTS AND CONFIDENCE INTERVALS
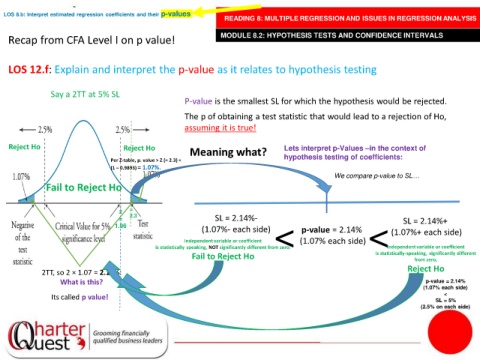
LOS 12.f: Explain and interpret the p-value as it relates to hypothesis testing
Say a 2TT at 5% SL
P-value is the smallest SL for which the hypothesis would be rejected.
The p of obtaining a test statistic that would lead to a rejection of Ho,
assuming it is true!
Reject Ho Reject Ho Lets interpret p-Values –in the context of
Meaning what?
Per Z-table, p. value > Z (= 2.3) = hypothesis testing of coefficients:
(1 – 0.9893) = 1.07%.
We compare p-value to SL…
Fail to Reject Ho
z =
= 2.3 SL = 2.14%- SL = 2.14%+
1.96
(1.07%- each side) < p-value = 2.14% (1.07%+ each side)
Independent variable or coefficient (1.07% each side)
is statistically speaking, NOT significantly different from zero: < Independent variable or coefficient
Fail to Reject Ho is statistically-speaking, significantly different
from zero,
Reject Ho
2TT, so 2 × 1.07 = 2.14%:
What is this? p-value = 2.14%
(1.07% each side)
Its called p value! <
SL = 5%
(2.5% on each side)