Page 118 - CombinedTest_Neat
P. 118

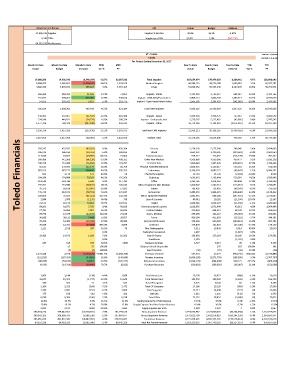
Actual Current Period                            KPI           Actual   Budget  Variance
                17,605,239 Supplies                          Supplies % Net Rev  20.9%  16.2%    -4.67%
                  6,240 EIPAs                                 Supplies per EIPA  $2,821  2,194  ($627.35)
                84,353,238 Net Revenue

                                                              67 - Toledo                                     RUN DATE: 1/10/2018
                                                               Toledo                                         RUN TIME: 8:18:46 AM
                                                        For Periods Ending December 31, 2017
             Month To Date  Month To Date  Month To Date  MTD  MTD            Year To Date  Year To Date  Year To Date  YTD  YTD
               Actual   Budget    Variance  Var %  PY                          Actual   Budget  Variance  Var %  PY
                              17,605,239                     14,008,342                      (3,596,897)  -25.7%               10,357,812  Total Supplies              167,654,674              175,979,635                  8,324,961   4.7%               155,058,043
                                5,994,203                       3,565,661                      (2,428,542)  -68.1%                 2,524,530  Medical Surgical                46,586,225                48,276,288                  1,690,063   3.5%                 42,837,181
                                4,680,415                       4,876,042                            195,627  4.0%                 4,457,124  Drugs                53,626,352                59,934,246                  6,307,895   10.5%                 49,251,971
                                     186,968                          218,303                               31,336  14.4%                      71,854  Implant - Stents                  2,114,410                   2,715,427                       601,017  22.1%                   2,431,765
                                     252,072                          678,457                            426,385   62.8%                    630,554  Implant - CRM AICD/Pacemakers                  5,909,213                   7,406,730                   1,497,517   20.2%                   6,977,079
                                       97,875                          103,502                                 5,627  5.4%                    218,775  Implant - Open Heart/Heart Valves                  1,565,503                   1,304,493                      (261,010)   -20.0%                   1,434,982
                                     536,914                       1,000,262                            463,348  46.3%                    921,184  Total CRM Implants                  9,589,126                 11,426,650                  1,837,525   16.1%                 10,843,826
                                     448,391                          397,057                            (51,334)   -12.9%                    361,488  Implant - Spinal                  4,239,418                   4,956,475                       717,057  14.5%                   3,805,542
                                     524,549                          449,821                            (74,728)   -16.6%                    580,374  Implant - Orthopedic Joint                  5,570,267                   5,527,462                        (42,805)  -0.8%                   5,747,547
                                1,177,796                            780,448                         (397,348)  -50.9%                    959,513  Implant - Other                11,779,426                  9,704,219                  (2,075,207)  -21.4%                 10,337,469
                                2,150,736                       1,627,326                         (523,410)  -32.2%                 1,901,375  Total Non-CRM Implants                21,589,111                20,188,155                 (1,400,955)  -6.9%                 19,890,558
                                                                                                          1.4%
                                                                                                                30,734,385
                                                               Implant Total
                                                  2,822,558
                                           -2.3%
                                2,687,650                       2,627,588                           (60,062)  (45,361)  (10,762)  (59,992)   -105.1%                      450,184  Endomechanical                31,178,236                31,614,806                      (194,583)  (213,720)  436,569  -29.9%                      5,424,003
         Toledo Financials                            508,486                          442,368  113,308  179,095  687,772  174,884  124,746  113,940  147,672   58,166                           122,573  300,460  (66,118)  (76,850)  (78,812)  (12,007)  (78,558)  70,503  -14.9%                    408,352  Minor Equipment Non-Medical                  4,508,889  2,060,440  1,606,355  9,193,574  1,633,013  1,283,765  1,360,367  2,449,656   783,492                  4,959,366  1,402,039  2,1

                                           -9.9%
                                                                Dietary

                                                                                                          5.4%
                                                                                                   299,045

                 503,297
                                                                                         5,573,548
                           457,935

                                                                                5,274,503


                                                   188,825
                                                                                                         -8.0%

                 196,912
                                           -5.8%
                           186,150
                                                                                         2,440,325
                                                                                                                2,509,064


                                                                Blood

                                                                                2,634,907
                 117,049


                                                                                 929,212
                                                                                                                 702,352

                                                                                          715,492
                                                   77,866
                           57,057


                                                             Other Non-Medical
                                                                                                          9.1%
                                                                                                                1,294,466
                                                               IV and IV Sets
                 190,158
                                                   118,781


                                           -67.8%


                                           68.4%
                                                   50,709


                                                                                                   553,263

                                                            Physical Plant/Maintenance
                                                                                                         25.6%
                                                                                                                 536,506


                 56,521


                                                                                                                8,946,151
                                                               Laboratory


                                                                                                   (96,347)
                                                                                                         -1.1%
                                                   595,155
                                           43.7%

                 387,313
                                                                                          13,728

                                       573
                                                     58
                                                                                  15,762
                                                             Chemistry Supplies

                                                                                                                  8,936
                   605

                                           48.6%
                            1,178
                                                                                                         -14.8%


                                                                                                   (2,034)
                                           40.3%
                                                                                                         24.5%

                 104,380
                                                               Radiology
                                                                                                                1,933,946
                                                                                                   530,031


                                                   176,368


                                                   117,783

                                            4.2%
                 119,540
                                                                Office

                                                                                                   190,494

                                                                                                                1,760,999

                                                                                                         12.9%

                                      5,206

                                                                                                                1,250,091
                                                                                                         -9.1%
                                                   136,587


                                           -69.2%


                 192,752


                                                                Suture
                                                                                                   (60,076)
                                                                                                         -8.3%
                                                   57,091

                 70,173
                                           -20.6%


                                                                                                                 735,959
                                                                                                                2,129,422


                                                   225,017
                 226,230
                                                                                                         -32.9%


                                                               Instruments
                                           -53.2%

                                                                                                         -22.2%
                                                                                                                1,223,847

                                      (1,135)


                  2,844
                                                                                  40,341
                            1,709
                                                              Linen & Laundry

                                                     738
                                           -66.4%
                                                                                          19,182
                                                                                                                1,043,960
                                                                                                   (11,350)
                                                                Freight
                           92,175

                                                                                         1,038,197

                                                                                                         -1.1%
                                           76.7%
                                                   107,522

                 21,511


                                                                                                   43,313
                                                                                                          4.0%
                                                                                                                1,064,499
                                                                                         1,071,949

                                                   99,819
                                            8.4%
                                                            Housekeeping & Laundry
                 84,203
                           91,972

                                      7,768


                                                                                                   45,276


                           34,808
                                      7,057
                                                                                                         10.7%
                                                   43,874
                                                              Contrast Media

                 27,751
                                           20.3%
                                                                                          424,311
                                                                                                         -35.3%
                 39,774
                                                                                                   (78,063)
                                       156,654                              75,503                           (81,151)  (22,194)  70,663  -107.5%                    132,139  Minor Equipment Medical                  1,085,935  1,049,546  1,028,636   379,034                      888,580                     (197,355)   (21,160)  -110.3%                         435,614  202,841   12,367
                                                   27,620
                                          -126.3%

                                                                                          221,127
                                                              Gases, Medical


                                                                                 299,190
                           17,579

                                       30,685                              38,133                                7,448  19.5%                      36,037  Forms                      426,204                      411,093                       (15,110)  -3.7%                       348,191
                                       73,258                              53,489                           (19,769)   -37.0%                      48,494  Fuel (aircraft & auto)                      724,603                      620,189                     (104,414)   -16.8%                       825,781
                                       70,829                              12,761                           (58,068)   -455.0%                         4,879   Uniforms                      178,839                      151,691                       (27,148)  -17.9%                       179,172
                                         1,121                                1,518                                   397  26.2%                               78  Film, Radiographic                          9,511                        18,430                          8,919  48.4%                         23,035
                                            -                                     -                                     -    0.0%                              -  Radiopharmaceuticals                          1,697                              -                           (1,697)  0.0%                                -
                                       13,426                              14,535                                1,109  7.6%                      16,202  Pack & Gowns                      158,058                      176,164                        18,106  10.3%                       174,581
                                            -                                     -                                     -    0.0%                              -  Anesthesia                          1,303                              -                           (1,303)  0.0%                                -
                                            247                                  619                                  373  60.1%                          (150)   Research Animals                          6,727                          6,813                                 85  1.3%                            9,365
                                            -                                       17                                      17   100.0%                              -  Dietary Utensils Disposable                              -                               287                               287   100.0%                               141
                                            -                                        (4)                                     (4)  100.0%                              -  Dept Transfers                               (42)                              (73)                              (31)  42.0%                                (36)
                                1,272,440                                2,166                      (1,270,274) -58641.5%                (2,268,340)  Inventory Variance                      581,534                        27,377                     (554,158)   -2024.2%                  (2,730,881)
                                  (122,823)                        (167,424)                          (44,601)   26.6%                   (144,688)  Premier Incentive                 (1,686,190)                (1,871,776)                    (185,586)   9.9%                  (1,767,787)
                                     (98,035)                             (59,978)                               38,057  -63.5%                   (147,377)  Rebates & Incentives                 (1,624,118)                    (694,948)                       929,171  -133.7%                     (900,218)
                                        (4,333)                           (14,798)                            (10,466)   70.7%                       (6,022)  Purchase Discounts                     (130,881)                      (166,888)                        (36,007)  21.6%                     (151,996)
                                         3,006                                3,144                                  (138)  -4.4%                         2,988   Total Admissions                        36,238                        36,927                             (689)  -1.9%                         35,619
                                       11,674                              13,421                               (1,747)  -13.0%                      12,640  Total Patient Days                      152,933                      158,202                         (5,269)  -3.3%                       156,448
                                            580                                  563                                    17   3.1%                             537  Total IP Surgeries                          6,325                          6,243                                 82  1.3%                            6,146
                                         2,160                                2,328                                  (168)  -7.2%                         2,472   Total OP Surgeries                        27,386                        28,195                             (809)  -2.9%                         27,500
                                         2,740                                2,891                                  (151)  -5.2%                         3,009   Total Surgeries                        33,711                        34,438                             (727)                 (0)                         33,646
                                            175                                  190                                   (15)  -7.8%                             191  Cath Lab                          2,113                          2,525                             (412)                 (0)                            2,343
                                         6,240                                6,386                                  (146)  -2.3%                         6,238   Total EIPAs                        75,252                        78,852                         (3,600)                 (0)                         75,022
                  18.0%     14.4%      3.6%  25.1%  11.2%  Supply Expense % of Net Revenue  14.5%  14.8%  -0.3%  -2.1%  14.1%
                  20.9%     16.2%      4.7%  28.8%  12.9%  Supply Expense % of Net Patient Revenue  16.4%  16.6%  -0.2%  -1.3%  15.9%
                                         2,821                                2,194                                  (628)  -28.6%                         1,661   Supply Expense per EIPA                          2,228                          2,232                                  4    0.2%                            2,067
                            185,924,274                   199,842,855                    (13,918,581)  -7.0%            181,199,530  Gross Inpatient Revenue           2,297,595,982           2,327,860,676               (30,264,694)  -1.3%            2,137,759,671
                            200,041,195                   206,009,705                      (5,968,510)  -2.9%            197,064,077  Gross Outpatient Revenue           2,473,612,709           2,642,876,829             (169,264,120)  -6.4%            2,364,859,947
                            385,965,470                   405,852,560                    (19,887,091)  -4.9%            378,263,607  Total Gross Revenue           4,771,208,692           4,970,737,505             (199,528,814)  -4.0%            4,502,619,618
                              84,353,238                     86,439,228                      (2,085,990)  -2.4%               80,045,123  Total Net Patient Revenue           1,021,413,033           1,057,740,220               (36,327,187)  -3.4%               976,837,616
   113   114   115   116   117   118   119   120   121   122   123