
Page 136 - CombinedTest_Neat
P. 136
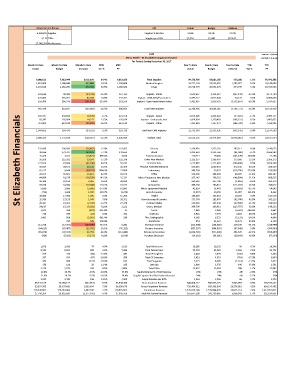
Actual Current Period KPI Actual Budget Variance
6,000,813 Supplies Supplies % Net Rev 21.6% 24.2% 2.57%
3,119 EIPAs Supplies per EIPA $1,924 $2,440 $516.05
27,748,354 Net Revenue
6130 RUN DATE: 1/10/2018
Mercy Health – St. Elizabeth Youngstown Hospital RUN TIME: 8:18:46 AM
For Periods Ending December 31, 2017
Month To Date Month To Date Month To Date MTD MTD Year To Date Year To Date Year To Date YTD YTD
Actual Budget Variance Var % PY Actual Budget Variance Var % PY
6,000,813 7,012,999 1,012,186 14.4% 6,612,189 Total Supplies 84,172,796 85,061,156 888,360 1.0% 76,973,252
1,910,960 2,368,848 457,888 19.3% 1,790,868 Medical Surgical 26,771,274 28,556,352 1,785,077 6.3% 26,148,086
1,283,518 2,156,299 872,781 40.5% 2,166,386 Drugs 25,716,779 26,591,573 874,795 3.3% 19,939,593
123,636 98,900 (24,736) -25.0% 127,763 Implant - Stents 1,520,637 1,213,287 (307,349) -25.3% 1,172,784
473,403 555,761 82,358 14.8% 557,352 Implant - CRM AICD/Pacemakers 6,787,212 6,821,444 34,233 0.5% 6,806,040
358,400 166,976 (191,424) -114.6% 281,550 Implant - Open Heart/Heart Valves 3,481,087 2,048,433 (1,432,654) -69.9% 2,534,627
955,440 821,637 (133,802) -16.3% 966,665 Total CRM Implants 11,788,936 10,083,165 (1,705,771) -16.9% 10,513,450
St Elizabeth Financials
239,347 230,698 (8,649) -3.7% 221,170 Implant - Spinal 2,879,603 2,832,318 (47,285) -1.7% 2,909,747
93,347 107,664 14,317 13.3% 126,019 Implant - Orthopedic Joint 1,429,054 1,320,803 (108,251) -8.2% 1,405,852
712,002 612,108 (99,893) -16.3% 612,529 Implant - Other 7,424,684 7,237,974 (186,709) -2.6% 7,358,905
1,044,695 950,470 (94,225) -9.9% 959,718 Total Non-CRM Implants 11,733,340 11,391,095 (342,245) -3.0% 11,674,503
2,000,135 1,772,108 (228,027) -12.9% 1,926,383 Implant Total 23,522,276 21,474,260 (2,048,016) -9.5% 22,187,954
232,438 206,036 (26,402) -12.8% 162,603 Dietary 2,139,991 2,325,202 185,211 8.0% 2,190,653
40,586 179,707 139,122 77.4% 241,663 Blood 2,293,659 2,211,760 (81,900) -3.7% 2,606,989
15,424 1,552 (13,871) -893.6% 3,536 Endomechanical 120,721 19,043 (101,678) -534.0% 22,288
95,958 115,932 19,974 17.2% 125,140 Other Non-Medical 1,133,357 1,306,407 173,050 13.2% 1,386,173
122,614 91,433 (31,180) -34.1% 91,242 IV and IV Sets 1,227,987 1,121,687 (106,300) -9.5% 1,024,760
36,564 94,875 58,312 61.5% 35,300 Physical Plant/Maintenance 596,465 1,069,001 472,536 44.2% 430,359
65,217 4,644 (60,573) -1304.3% 27,604 Laboratory 383,769 56,973 (326,796) -573.6% 106,508
20,475 35,881 15,407 42.9% 59,970 Office 358,596 404,630 46,035 11.4% 445,247
44,898 18,528 (26,370) -142.3% 25,131 Minor Equipment Non-Medical 357,147 208,763 (148,384) -71.1% 808,635
26,104 29,158 3,055 10.5% 28,049 Suture 359,525 357,709 (1,816) -0.5% 331,170
33,734 16,046 (17,688) -110.2% 31,515 Instruments 308,138 196,851 (111,287) -56.5% 243,017
5,680 2,080 (3,600) -173.0% 18,843 Minor Equipment Medical 42,824 23,441 (19,383) -82.7% 54,042
(296) 1,424 1,720 120.7% (1,376) Linen & Laundry (5,037) 16,050 21,087 131.4% 8,362
16,460 17,964 1,505 8.4% 15,206 Freight 184,469 202,653 18,183 9.0% 192,516
15,786 17,129 1,343 7.8% 20,152 Housekeeping & Laundry 275,738 192,997 (82,740) -42.9% 242,223
26,167 23,422 (2,745) -11.7% 27,170 Contrast Media 319,916 287,330 (32,586) -11.3% 310,524
24,617 15,236 (9,381) -61.6% 2,222 Gases, Medical 304,700 186,913 (117,787) -63.0% 148,313
1,071 254 (817) -321.8% 11 Forms 7,082 2,899 (4,183) -144.3% 3,667
714 690 (23) -3.4% 152 Uniforms 3,916 7,779 3,863 49.7% 6,139
3,461 508 (2,953) -581.4% 299 Film, Radiographic 8,365 6,231 (2,133) -34.2% 4,894
- 915 915 100.0% - Anesthesia 851 11,222 10,371 92.4% 6,354
112,738 (17,261) (129,999) 753.1% 5,281 Inventory Variance (313,598) (194,489) 119,109 -61.2% (228,999)
(64,625) (87,407) (22,782) 26.1% (76,125) Premier Incentive (887,207) (984,855) (97,648) 9.9% (930,083)
(69,074) (47,322) 21,752 -46.0% (113,489) Rebates & Incentives (1,024,726) (533,200) 491,526 -92.2% (658,897)
(509) (5,682) (5,173) 91.0% (1,548) Purchase Discounts (34,181) (64,026) (29,844) 46.6% (57,234)
1,678 1,599 79 4.9% 1,515 Total Admissions 19,185 19,135 50 0.3% 18,348
8,322 8,064 258 3.2% 7,686 Total Patient Days 95,494 93,228 2,266 2.4% 93,772
276 336 (60) -17.8% 287 Total IP Surgeries 3,620 3,970 (350) -8.8% 3,523
287 354 (67) -18.9% 350 Total OP Surgeries 3,651 4,415 (764) -17.3% 3,894
563 690 (127) -18.4% 637 Total Surgeries 7,271 8,385 (1,114) -13.3% 7,417
158 130 28 21.4% 139 Cath Lab 1,866 1,376 490 35.6% 1,381
3,119 2,875 245 8.5% 2,864 Total EIPAs 35,657 35,059 598 1.7% 33,902
20.8% 23.4% -2.5% -10.8% 23.8% Supply Expense % of Net Revenue 23% 24% -1% -2.6% 23%
21.6% 24.2% -2.5% -10.5% 24.4% Supply Expense % of Net Patient Revenue 24% 24% -1% -2.7% 24%
1,924 2,440 516 21.1% 2,309 Supply Expense per EIPA 2,361 2,426 66 2.7% 2,270
69,733,519 70,186,175 (452,657) -0.6% 63,958,386 Gross Inpatient Revenue 848,450,272 840,505,175 7,945,097 0.9% 766,916,352
59,897,383 55,997,689 3,899,694 7.0% 56,956,679 Gross Outpatient Revenue 728,464,922 699,488,904 28,976,018 4.1% 650,139,482
129,630,901 126,183,864 3,447,038 2.7% 120,915,065 Total Gross Revenue 1,576,915,194 1,539,994,079 36,921,114 2.4% 1,417,055,833
27,748,354 29,025,699 (1,277,345) -4.4% 27,045,766 Total Net Patient Revenue 355,647,108 349,789,065 5,858,043 1.7% 325,184,054