
Page 142 - CombinedTest_Neat
P. 142
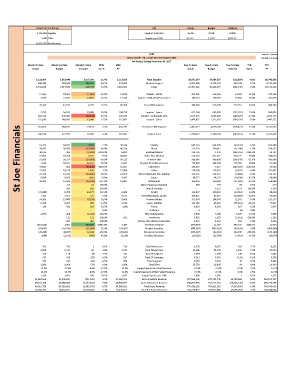
Actual Current Period KPI Actual Budget Variance
2,126,904 Supplies Supplies % Net Rev 16.3% 22.4% 6.08%
1,890 EIPAs Supplies per EIPA $1,125 $1,601 $475.65
13,035,705 Net Revenue
6140 RUN DATE: 1/10/2018
Mercy Health – St. Joseph Warren Hospital SJHC RUN TIME: 8:18:46 AM
For Periods Ending December 31, 2017
Month To Date Month To Date Month To Date MTD MTD Year To Date Year To Date Year To Date YTD YTD
Actual Budget Variance Var % PY Actual Budget Variance Var % PY
2,126,904 3,143,990 1,017,086 32.4% 3,112,566 Total Supplies 38,071,247 37,954,727 (116,519) -0.3% 36,796,268
440,385 788,646 348,261 44.2% 679,060 Medical Surgical 8,975,690 9,558,729 583,039 6.1% 9,730,438
1,438,816 1,644,556 205,740 12.5% 1,684,383 Drugs 20,407,822 19,806,577 (601,245) -3.0% 18,312,138
27,965 20,902 (7,063) -33.8% 33,810 Implant - Stents 201,463 256,356 54,893 21.4% 249,286
7,370 21,203 13,833 65.2% 12,376 Implant - CRM AICD/Pacemakers 187,324 260,181 72,858 28.0% 241,418
35,335 42,105 6,770 16.1% 46,186 Total CRM Implants 388,786 516,538 127,751 24.7% 490,704
3,295 54,183 50,888 93.9% 104,728 Implant - Spinal 822,360 665,078 (157,282) -23.6% 860,879
202,115 138,004 (64,111) -46.5% 135,585 Implant - Orthopedic Joint 2,079,435 1,692,806 (386,629) -22.8% 1,833,733
-8.0%
155,645 188,685 380,871 422,976 33,040 17.5% 215,882 Total Non-CRM Implants 2,499,875 5,401,671 5,790,457 2,315,316 4,673,200 5,189,738 (184,559) (728,471) (600,719) -15.6% 2,447,153
Implant - Other
St Joe Financials 53,791 58,041 36,551 -2420.9% 48,518 Minor Equipment Non-Medical 684,461 661,040 (108,755) (100,349) (183,205) 135,171 -2188.3% 654,288 624,156 594,574 485,906 231,497 376,751 20,707
19,817
456,195
361,055
5.2%
5,141,765
396,390
Implant Total
-11.6%
26,586
5,632,469
502,381
6.3%
(23,421)
-3.5%
7.3%
4,250
Dietary
700,012
46,258
711,210
56,903
-40.4%
(22,992)
Blood
-1.6%
79,895
(11,198)
405
4,970
(9,810)
113,725
Endomechanical
6,804
10,215
516,201
57,254
651,372
45,501
52,063
Other Non-Medical
20.8%
9.1%
5,192
49,212
IV and IV Sets
-21.4%
-38.9%
(14,883)
468,698
38,214
569,046
53,098
41,368
Physical Plant/Maintenance
179,003
58.8%
255,285
6,542
38,181
434,288
95.7%
1,630
35,044
5,657
44,881
461
15,007
(44,420)
Laboratory
-9630.3%
-3238.4%
188,863
Office
(9,592)
-4.4%
218,516
228,108
17,999
19,193
1,430
17,763
7.5%
11,263
(3,864)
22,110
128,111
(10,846)
131,975
-96.3%
22,056
-3.0%
6,053
9,307
-32.7%
98,522
74,237
Suture
6,894
-13.9%
(37,023)
(15,378)
Instruments
-23.1%
158,848
9.1%
690
629
759
-
69
-
100.0%
67
67
3,237
285
Linen & Laundry
3,237
100.0%
285
-
2,230
-
-
113,937
-13.9%
367.3%
32,277
Freight
(13,862)
89,604
100,076
3,404
8,788
(23,489)
(19,889)
93,858
-23.4%
7,101
375
7,475
104,915
85,027
9,571
28,421 13,043 (841) -117.9% 18,887 Minor Equipment Medical 196,991 159,969 (24,284) 100.0% 80,984
Housekeeping & Laundry
5.0%
24,166 15,008 (9,158) -61.0% 9,468 Contrast Media 171,874 184,074 12,201 6.6% 132,177
6,163 6,967 805 11.5% 3,478 Gases, Medical 141,146 85,455 (55,691) -65.2% 77,837
139 381 242 63.5% (143) Forms 4,063 4,330 267 6.2% 5,457
- - - 0.0% - Uniforms 4 - (4) 0.0% -
1,696 468 (1,228) -262.3% - Film, Radiographic 3,864 5,740 1,876 32.7% 5,948
- 132 132 100.0% 423 Anesthesia 5,015 1,623 (3,391) -208.9% 1,593
- 407 407 100.0% - Dietary Utensils Non-Disposable 4,472 4,635 163 3.5% 3,956
(481,646) 1,861 483,507 25982.0% 3,187 Inventory Variance (476,059) 21,167 497,225 2349.1% 11,929
(32,647) (43,741) (11,094) 25.4% (38,457) Premier Incentive (448,199) (497,529) (49,330) 9.9% (469,860)
(20,285) (8,087) 12,198 -150.8% (29,041) Rebates & Incentives (336,267) (91,981) 244,286 -265.6% (125,183)
(644) (1,213) (569) 46.9% (1,238) Purchase Discounts (10,282) (13,799) (3,518) 25.5% (13,075)
703 702 1 0.1% 724 Total Admissions 8,792 8,167 625 7.7% 8,221
2,828 2,774 54 1.9% 2,974 Total Patient Days 34,605 32,270 2,335 7.2% 34,024
110 119 (9) -7.7% 141 Total IP Surgeries 1,518 1,390 128 9.2% 1,447
413 428 (15) -3.5% 517 Total OP Surgeries 5,241 5,352 (111) -2.1% 5,539
523 547 (24) -4.5% 658 Total Surgeries 6,759 6,741 18 0.3% 6,986
1,890 1,963 (74) -3.8% 1,986 Total EIPAs 23,739 23,645 94 0.4% 23,414
15.9% 21.9% -6.0% -27.2% 22.5% Supply Expense % of Net Revenue 22.4% 21.9% 0.5% 2.3% 22.1%
16.3% 22.4% -6.0% -27.0% 22.8% Supply Expense % of Net Patient Revenue 22.9% 22.3% 0.6% 2.5% 22.4%
1,126 1,601 476 29.7% 1,567 Supply Expense per EIPA 1,604 1,605 1 0.1% 1,572
22,664,562 23,095,692 (431,130) -1.9% 23,460,291 Gross Inpatient Revenue 287,566,305 270,785,745 16,780,560 6.2% 262,823,757
38,255,158 41,488,006 (3,232,847) -7.8% 40,900,591 Gross Outpatient Revenue 488,871,978 513,217,216 (24,345,238) -4.7% 485,724,288
60,919,720 64,583,698 (3,663,978) -5.7% 64,360,881 Total Gross Revenue 776,438,283 784,002,961 (7,564,678) -1.0% 748,548,045
13,035,705 14,063,761 (1,028,056) -7.3% 13,636,052 Total Net Patient Revenue 166,220,827 169,911,886 (3,691,059) -2.2% 164,344,044