
Page 5 - CombinedTest_Neat
P. 5
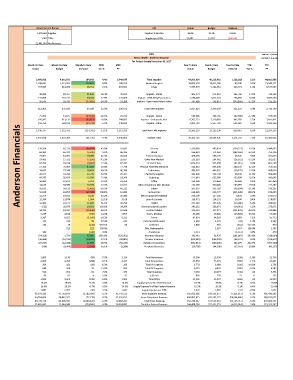
Actual Current Period KPI Actual Budget Variance
3,976,662 Supplies Supplies % Net Rev 18.5% 19.2% 0.65%
1,905 EIPAs Supplies per EIPA $2,087 $2,057 ($30.49)
21,441,083 Net Revenue
6301 RUN DATE: 1/10/2018
Mercy Health - Anderson Hospital RUN TIME: 8:18:46 AM
For Periods Ending December 31, 2017
Month To Date Month To Date Month To Date MTD MTD Year To Date Year To Date Year To Date YTD YTD
Actual Budget Variance Var % PY Actual Budget Variance Var % PY
3,976,662 4,161,553 184,892 4.4% 2,740,677 Total Supplies 47,093,624 48,225,991 1,132,368 2.3% 44,031,595
1,196,042 1,313,503 117,461 8.9% 298,550 Medical Surgical 14,826,538 14,912,784 86,246 0.6% 13,548,771
794,364 811,096 16,731 2.1% 672,563 Drugs 9,357,579 9,481,551 123,971 1.3% 8,527,567
40,888 82,357 41,469 50.4% 49,033 Implant - Stents 805,474 971,210 165,736 17.1% 798,250
132,868 172,232 39,364 22.9% 137,059 Implant - CRM AICD/Pacemakers 1,734,469 2,031,274 296,805 14.6% 1,697,284
38,545 20,920 (17,625) -84.3% 39,980 Implant - Open Heart/Heart Valves 387,680 246,814 (140,866) -57.1% 215,235
212,301 275,509 63,208 22.9% 226,072 Total CRM Implants 2,927,624 3,249,299 321,675 9.9% 2,710,769
75,993 41,647 (34,346) -82.5% 24,222 Implant - Spinal 569,686 486,785 (82,900) -17.0% 599,526
676,992 611,135 (65,857) -10.8% 748,882 Implant - Orthopedic Joint 6,702,731 7,110,681 407,950 5.7% 7,411,411
5,517,730
493,752 1,121,795 (124,942) -11.1% 1,213,933 Total Non-CRM Implants 12,265,139 13,115,196 525,007 9.5% 12,594,253
Implant - Other
(24,739)
440,829
4,583,316
469,013
-5.3%
4,992,722
Anderson Financials 120,204 85,226 (34,978) 19,690 -41.0% 91,882 Minor Equipment Non-Medical 1,130,380 1,013,513 956,829 995,824 (134,557) (182,260) 268,539 -13.5% 1,049,065
1,246,737
850,057
6.5%
Implant Total
-4.4%
1,440,005
7.2%
1,171,732
1,397,304
15,305,022
1,459,038
15,192,763
(61,735)
16,364,495
Dietary
86,196
65,494
-4.1%
(2,690)
-23.5%
752,146
774,569
68,184
Blood
43,491
471,075
9.8%
49,545
45.3%
45,010
Endomechanical
508,139
458,594
23,801
231,383
204,462
17,313
-41.3%
(7,156)
Other Non-Medical
35,657
24,469
262,827
(26,921)
-13.2%
87,793
-12.3%
862,195
(9,607)
922,498
87,132
-9.9%
IV and IV Sets
(91,015)
78,186
75,009
565,061
27,183
63.8%
Physical Plant/Maintenance
77,790
755,558
32.2%
833,600
47,826
Laboratory
46,198
49.2%
19,065
496,367
441,992
37,548
-12.3%
(54,375)
438,634
18,483
Chemistry Supplies
11.8%
25,167
33,204
12,729
391,744
46,136
345,609
360,869
38.3%
20,475
153,839
511,841
12,638
22.4%
43,785
Radiology
33,709
23.1%
545,096
665,680
56,423
Office
287,464
279,863
18,461
22.5%
26,360
253,504
9.4%
23,259
23,812
5,351
16,294
212,287
255,589
30,930
360,686
105,097
31,312
14,635
52.7%
29.1%
-18.2%
(5,483)
Suture
-11.0%
634,426
Instruments
16,980
18,850
212,777
56,699
8,226
227,128
28,484
19,505
11,279
8,829
218,299
3.9%
42.2%
154,151
13,874
12,190
Linen & Laundry
9,528
139,651
9.4%
14,500
1,684
12.1%
-5.4%
11,302
(13,940)
271,269
23,122
51.1%
Freight
30,796
257,329
(523)
102.6%
242,132
(14,061)
20,078
228,071
24,204
-6.2%
Housekeeping & Laundry
20,601
34,703
-49.2%
339,151
227,271
-80.1%
Contrast Media
35,612 30,129 (37,849) (15,436) 11,820 -200.8% 45,112 Minor Equipment Medical 391,397 352,763 (421,649) (111,879) (38,634) -198.2% 370,255 183,605 195,972 159,857 266,817 273,671 222,886
19,267
10,946
5,359 4,814 (545) -11.3% 2,957 Gases, Medical 82,490 56,686 (25,804) -45.5% 55,438
9,167 8,022 (1,145) -14.3% 6,123 Forms 87,914 94,583 6,669 7.1% 91,713
155 213 58 27.3% 223 Fuel (aircraft & auto) 2,403 2,372 (31) -1.3% 2,547
155 39 (116) -297.1% 66 Uniforms 1,002 461 (541) -117.2% 670
- 225 225 100.0% - Film, Radiographic - 2,657 2,657 100.0% 1,307
340 - (340) 0.0% - Anesthesia 1,313 - (1,313) 0.0% 478
(54,326) 3,729 58,055 1556.8% (325,951) Inventory Variance 142,442 41,435 (101,007) -243.8% (310,024)
(38,466) (52,758) (14,292) 27.1% (45,803) Premier Incentive (528,083) (586,205) (58,122) 9.9% (559,617)
(23,727) (12,088) 11,639 -96.3% (56,234) Rebates & Incentives (500,944) (138,869) 362,075 -260.7% (257,420)
(758) (4,006) (3,248) 81.1% (1,184) Purchase Discounts (26,790) (44,508) (17,718) 39.8% (45,137)
1,085 1,170 (85) -7.3% 1,114 Total Admissions 13,206 13,336 (130) -1.0% 12,718
4,420 4,708 (288) -6.1% 4,337 Total Patient Days 52,956 53,541 (585) -1.1% 47,831
264 282 (18) -6.3% 289 Total IP Surgeries 2,772 3,098 (326) -10.5% 2,756
648 569 79 13.9% 653 Total OP Surgeries 6,591 6,976 (385) -5.5% 6,782
912 851 61 7.2% 942 Total Surgeries 9,363 10,074 (711) (0) 9,538
66 62 4 5.9% 52 Cath Lab 801 778 23 0 757
1,905 2,023 (118) -5.8% 1,901 Total EIPAs 23,232 23,927 (696) (0) 22,849
18.3% 19.0% -0.7% -3.8% 14.3% Supply Expense % of Net Revenue 19.1% 19.0% 0.1% 0.5% 18.8%
18.5% 19.2% -0.7% -3.5% 14.5% Supply Expense % of Net Patient Revenue 19.3% 19.2% 0.1% 0.4% 19.0%
2,087 2,057 (30) -1.5% 1,441 Supply Expense per EIPA 2,027 2,016 (12) -0.6% 1,927
45,979,125 47,761,634 (1,782,509) -3.7% 45,747,272 Gross Inpatient Revenue 535,922,366 543,153,677 (7,231,311) -1.3% 485,410,363
34,764,606 34,842,325 (77,719) -0.2% 32,335,013 Gross Outpatient Revenue 406,857,871 431,362,277 (24,504,406) -5.7% 386,673,071
80,743,731 82,603,959 (1,860,228) -2.3% 78,082,285 Total Gross Revenue 942,780,237 974,515,954 (31,735,717) -3.3% 872,083,434
21,441,083 21,644,944 (203,860) -0.9% 18,964,085 Total Net Patient Revenue 244,408,538 251,331,551 (6,923,014) -2.8% 231,553,702