
Page 8 - CombinedTest_Neat
P. 8
Actual Budget Variance Prior Variance %
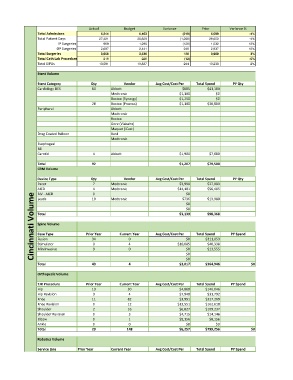
Total Admissions 5,244 5,463 (219) 5,099 -4%
Total Patient Days 27,421 28,629 (1,208) 26,650 -4%
IP Surgeries 969 1,095 (126) 1,032 -12%
OP Surgeries 2,687 2,441 246 2,937 10%
Total Surgeries 3,656 3,536 120 3,969 3%
Total Cath Lab Procedures 216 228 (12) -5%
Total EIPAs 10,581 10,337 244 10,233 2%
Stent Volume
Stent Category Qty Vendor Avg Cost/Cost Per Total Spend PY Qty
Cardiology DES 60 Abbott $685 $41,100
Medtronic $1,100 $0
Boston (Synergy) $1,250 $0
28 Boston (Promus) $1,100 $30,800
Peripheral Abbott
Medtronic
Boston
Gore (Viabahn)
Maquet (iCast)
Drug Coated Balloon Bard
Medtronic
Esophogeal
Bili
Carotid 4 Abbott $1,900 $7,600
Total 92 $1,207 $79,500
CRM Volume
Device Type Qty Vendor Avg Cost/Cost Per Total Spend PY Qty
Pacer 7 Medtronic $3,998 $27,983
4
AICD 19 Medtronic $14,101 $56,405
Cincinnati Volume Total Prior Year Current Year Avg Cost/Cost Per $0 Total Spend PY Spend
BIV - AICD
$0
0
$13,980
$736
Leads
Medtronic
$0
$3,139
$98,368
Spine Volume
Case Type
$311,053
$0
Fusion
34
0
$10,085
4
$40,338
0
Stimulator
$0
Min Invasive
$13,555
9
$0
$0
Total 43 0 4 $2,017 $364,946 $0
Orthopedic Volume
TJR Procedure Prior Year Current Year Avg Cost/Cost Per Total Spend PY Spend
Hip 13 30 $4,868 $146,046
Hip Revision 3 4 $7,948 $31,792
Knee 11 82 $3,991 $327,269
Knee Revision 0 12 $13,551 $162,610
Shoulder 2 16 $6,827 $109,237
Shoulder Revision 0 3 $4,715 $14,146
Elbow 0 1 $8,156 $8,156
Ankle 0 0 $0 $0
Total 29 148 $6,257 $799,256 $0
Robotics Volume
Service Line Prior Year Current Year Avg Cost/Cost Per Total Spend PY Spend