
Page 11 - CombinedTest_Neat
P. 11
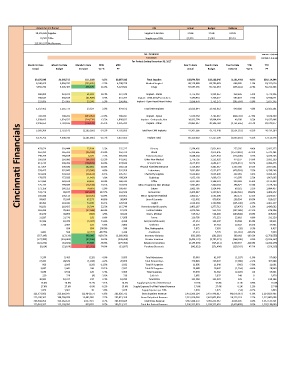
Actual Current Period KPI Actual Budget Variance
20,376,945 Supplies Supplies % Net Rev 17.6% 17.6% 0.03%
10,581 EIPAs Supplies per EIPA $1,926 $1,961 $35.19
115,963,337 Net Revenue
63 - Cincinnati RUN DATE: 1/10/2018
Cincinnati RUN TIME: 8:18:46 AM
For Periods Ending December 31, 2017
Month To Date Month To Date Month To Date MTD MTD Year To Date Year To Date Year To Date YTD YTD
Actual Budget Variance Var % PY Actual Budget Variance Var % PY
20,376,945 20,265,713 (111,232) -0.5% 16,657,915 Total Supplies 235,549,739 233,368,246 (2,181,493) -0.9% 220,119,244
6,140,425 6,004,791 (135,635) -2.3% 4,208,730 Medical Surgical 68,119,988 68,786,683 666,695 1.0% 63,332,024
4,456,732 5,303,407 846,675 16.0% 5,124,581 Drugs 59,957,335 59,712,054 (245,281) -0.4% 56,232,366
200,009 251,232 51,222 20.4% 227,340 Implant - Stents 2,775,432 2,934,057 158,626 5.4% 2,779,146
708,547 666,678 (41,869) -6.3% 451,267 Implant - CRM AICD/Pacemakers 7,180,936 7,768,422 587,487 7.6% 6,974,671
223,895 237,865 13,970 5.9% 256,065 Implant - Open Heart/Heart Valves 2,856,676 2,751,172 (105,504) -3.8% 2,627,345
1,132,452 1,155,775 23,324 2.0% 934,672 Total CRM Implants 12,813,044 13,453,652 640,608 4.8% 12,381,161
702,333 408,281 (294,052) -72.0% 486,827 Implant - Spinal 5,530,430 4,701,667 (828,763) -17.6% 4,846,320
1,839,413 1,624,675 (214,738) -13.2% 1,890,832 Implant - Orthopedic Joint 18,915,799 18,964,999 49,200 0.3% 19,637,988
Implant - Other
(776,370)
2,496,554 1,720,185 (1,285,160) -45.1% 2,325,234 Total Non-CRM Implants 22,861,337 20,106,782 (2,754,555) -13.7% 20,249,877
Cincinnati Financials 473,629 501,444 416,323 296,828 284,000 308,396 300,846 532,845 301,413 177,033 181,528 199,039 182,892 (45,911) (66,029) (25,580) (18,421) (26,138) 27,814 -11.0% 555,227 Minor Equipment Non-Medical 5,594,405 6,453,656 3,548,564 2,776,795 4,617,873 2,118,030 7,032,030 3,530,820 1,955,103 1,817,249 1,941,433
4,702,893
-34.2%
3,753,141
(3,534,118)
44,734,184
-8.1%
43,773,448
47,307,566
5,038,300
4,908,916
6,170,752
57,227,100
57,115,346
-5.1%
(2,893,510)
60,120,610
-25.7%
(1,261,836)
Implant Total
5,637,565
Dietary
4.4%
5.5%
5,242,481
Blood
452,279
(1,579,810)
462,234
6,620
385,936
290,209
3,473,143
Endomechanical
2.2%
-3.7%
3,092,199
350,030
-23.2%
474,297
441,861
Other Non-Medical
14.6%
-34.0%
(1,014,451)
IV and IV Sets
(104,839)
-28.2%
3,494,425
413,235
374,584
168,510
2,897,891
60.8%
Physical Plant/Maintenance
1,363,938
117,954
39.2%
-7.3%
532,350
-4.8%
6,299,248
Laboratory
558,425
-6.1%
122,981
295,357
3.4%
Chemistry Supplies
319,834
3,438,115
113,070
188,309
Radiology
(1,843)
1,862,005
178,876
5.5%
-1.0%
2,113,403
15.4%
30.0%
54,459
330,941
168,211
127,069
Office
398,871
267,916
225,177
2,519,244
17.0%
-13.1%
3.1%
60,261
Suture
(4,803)
-2.9%
233,214
(135,107)
263,504
(1,182,026)
Instruments
1,403,172
159,051
1,429,657
12.1%
-14.9%
156,438
48.8%
39,065
30.6%
268,954
813,617
38,900
Linen & Laundry
76,338
128,530
73,015
(125,108)
1,401,137
46,395
Freight
-9.0%
61.1%
1,430,682
(25,476)
22.5%
Housekeeping & Laundry
26,594
115,740
91,831
-1.8%
-17.2%
876,256
-48.4%
57,975
116,429
78,481
171,156 166,353 136,113 119,410 118,425 98,107 (20,325) (37,948) 37,273 -137.7% 188,497 Minor Equipment Medical 1,863,785 2,309,947 1,400,227 1,515,694 1,403,187 1,070,786 611,002 1,924,045 1,127,921 1,592,398 1,390,586 1,377,712 879,956 192,172 -104.8% 1,884,437
913,741
(157,045)
Contrast Media
45,670 44,803 (868) -1.9% 38,626 Gases, Medical 629,512 524,668 (104,844) -20.0% 469,818
31,587 31,779 192 0.6% 17,500 Forms 339,705 372,521 32,816 8.8% 332,320
15,596 10,289 (5,307) -51.6% 4,418 Fuel (aircraft & auto) 67,253 122,247 54,994 45.0% 89,931
3,744 3,967 223 5.6% 2,854 Uniforms 35,235 47,753 12,518 26.2% 37,901
- 654 654 100.0% 549 Film, Radiographic 7,675 7,655 (20) -0.3% 8,417
2,861 504 (2,357) -467.5% 1,126 Anesthesia 17,133 5,770 (11,363) -196.9% 7,923
(557,145) (17,139) 540,006 -3150.7% (2,660,903) Inventory Variance (582,260) (201,292) 380,968 -189.3% (2,758,555)
(177,392) (234,408) (57,016) 24.3% (209,459) Premier Incentive (2,435,332) (2,703,371) (268,038) 9.9% (2,559,147)
(121,272) (61,606) 59,666 -96.9% (279,353) Rebates & Incentives (2,145,678) (715,211) 1,430,467 -200.0% (1,206,275)
(5,814) (23,166) (17,352) 74.9% (11,057) Purchase Discounts (142,021) (271,404) (129,383) 47.7% (256,315)
5,244 5,463 (219) -4.0% 5,099 Total Admissions 59,940 61,047 (1,107) -1.8% 57,669
27,421 28,629 (1,208) -4.2% 26,650 Total Patient Days 319,848 326,947 (7,099) -2.2% 307,988
969 1,095 (126) -11.5% 1,032 Total IP Surgeries 11,005 11,940 (935) -7.8% 11,061
2,687 2,441 246 10.1% 2,937 Total OP Surgeries 28,088 29,442 (1,354) -4.6% 28,540
3,656 3,536 120 3.4% 3,969 Total Surgeries 39,093 41,382 (2,289) (0) 39,601
220 228 (8) -3.6% 236 Cath Lab 3,085 2,837 248 0 2,920
10,581 10,337 244 2.4% 10,233 Total EIPAs 121,458 121,223 235 0 118,156
16.4% 16.6% -0.2% -1.1% 14.5% Supply Expense % of Net Revenue 16.5% 16.4% 0.1% 0.8% 16.4%
17.6% 17.6% 0.0% -0.2% 15.6% Supply Expense % of Net Patient Revenue 17.6% 17.4% 0.2% 1.2% 17.4%
1,926 1,961 35 1.8% 1,628 Supply Expense per EIPA 1,939 1,925 (14) -0.7% 1,863
211,371,891 223,856,047 (12,484,157) -5.6% 201,626,731 Gross Inpatient Revenue 2,451,369,104 2,497,446,017 (46,076,913) -1.8% 2,214,683,405
215,108,161 199,706,078 15,402,083 7.7% 203,013,158 Gross Outpatient Revenue 2,515,919,068 2,461,805,950 54,113,119 2.2% 2,322,887,009
426,480,052 423,562,125 2,917,927 0.7% 404,639,889 Total Gross Revenue 4,967,288,172 4,959,251,967 8,036,205 0.2% 4,537,570,414
115,963,337 115,103,956 859,381 0.7% 106,713,122 Total Net Patient Revenue 1,336,331,919 1,339,752,418 (3,420,499) -0.3% 1,267,138,000