
Page 177 - 2.1
P. 177
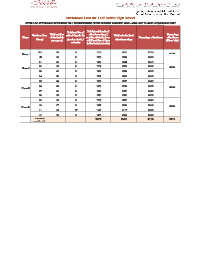
Attendance Data for  Gulf Indian High School
                DETAILS OF ATTENDANCE IN THE FIRST FULL TERM/SEMESTER OF THE CURRENT ACADEMIC YEAR - APRIL 2018 TO JUNE 2018(MORNING SHIFT)

                                                      Total possible school
                                          Total number of
                               Total number            attendance days (                               Percentage
                     Grade or Year       school days in the            Total actual school
               Phase           of students in         number of students on           Percentage attendance  attendance
                       Group              previous term /              attendance days
                                year group            roll X number of days                           (Phase wise)
                                            semester
                                                      in the term/semester)
                        KG         28         61           1708            1672            97.9%
              Phase I                                                                                   97.9%
                        UK         26         61           1586            1554            98.0%
                         01        31         61           1891            1855            98.1%
                         02        29         61           1769            1739            98.3%
              Phase II                                                                                  98.3%
                         03        31         61           1891            1859            98.3%
                         04        32         61           1952            1920            98.4%
                         05        30         61           1830            1797            98.2%
                         06        30         61           1830            1799            98.3%
              Phase III                                                                                 98.3%
                         07        31         61           1891            1857            98.2%
                         08        25         61           1525            1502            98.5%
                         09        29         61           1769            1737            98.2%
                         10        27         61           1647            1620            98.4%
              Phase IV                                                                                  98.3%
                         11        20         57           1140            1117            98.0%
                         12        23         61           1403            1384            98.6%
                      OVERALL
                     ATTENDANCE                            23832           23412           98.2%        98.2%