
Page 180 - 2.1
P. 180
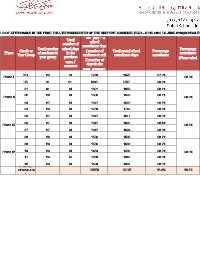
Attendance Data for  Gulf Indian High School

 DETAILS OF ATTENDANCE IN THE FIRST FULL TERM/SEMESTER OF THE CURRENT ACADEMIC YEAR - APRIL 2018 TO JUNE 2018(CONSOLIDATED)
                                                    Total possible
                                          Total
                                       number of        school
                        Total number   school days  attendance days                                            Percentage
             Grade or                                ( number of      Total actual school     Percentage
   Phase                of students in   in the                                                                attendance
           Year Group                              students on roll    attendance days        attendance
                         year group     previous     X number of                                              (Phase wise)
                                         term /
                                        semester     days in the
                                                   term/semester)

               KG            28            61           1708                1672                 97.9%
   Phase I                                                                                                       98.0%
                UK           26            61           1586                1557                 98.2%

                01           31            61           1891                1855                 98.1%

                02           26            61           1586                1556                 98.1%
   Phase II                                                                                                      98.3%
                03           27            61           1647                1622                 98.5%

                04           29            61           1769                1742                 98.5%

                05           27            61           1647                1617                 98.2%
                06           27            61           1647                1620                 98.4%
   Phase III                                                                                                     98.5%
                07           27            61           1647                1624                 98.6%

                08           26            61           1586                1565                 98.7%
                09           26            61           1586                1566                 98.7%

                10           24            61           1464                1435                 98.0%
  Phase IV                                                                                                       98.6%
                11           24            57           1368                1349                 98.6%

                12           23            61           1403                1387                 98.9%
             OVERALL
           ATTENDANC                                    22535               22167                98.4%           98.3%
                E