
Page 148 - North American & Caribbean Cruise Traveller
P. 148
Industry Insider:
North American & Caribbean Cruise Duty & Tax Free Retail 2015
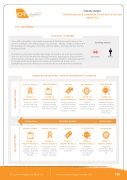
7.3 ALCOHOL
CATEGORY OVERVIEW
Over 40% of travellers in the North American & Caribbean region browse the Alcohol category, with 65% going on to purchase. Whisky, Vodka and Rum are the leading sub-categories; Bacardi, Johnnie Walker and Grey Goose are the leading brands.
Perceptions of product quality and range are positive for both the on-board and on-land Duty Free Alcohol offering. However, perceptions of promotions and Duty Free exclusives are much more negative. Enhance these perceptions by driving positive perceptions of value via promotional activity and highlighting exclusive offerings in communications and advertising materials.
Leading Buyers:
Canadians
Males
CATEGORY PERCEPTIONS – POSITIVE PERCEPTION VS. AVERAGE
PRODUCT QUALITY
SCORE: +13
PRIORITY RATING: 5
Perception most positive among shoppers under 40.
PRODUCT RANGE
SCORE: +6
PRIORITY RATING: 4
Perception most positive among shoppers under 40 and among males.
PRICING
SCORE: -2
PRIORITY RATING: 3
Pricing is rated less positively among shoppers over 40 vs. under 40 and in females vs. males.
PROMOTIONS
SCORE: -6
PRIORITY RATING: 2
Weaker perception among shoppers over 40 and Canadians.
DF EXCLUSIVES
SCORE: -10
PRIORITY RATING: 1
Weak perception driven by shoppers under 40. Weaker perception among Canadians vs. Americans.
Strongest Area PRIORITY RATING Weakest Area
PRODUCT RANGE
SCORE: +7
PRIORITY RATING: 5
Perception most positive among shoppers under 40 and in males vs. females.
PRODUCT QUALITY
SCORE: +5
PRIORITY RATING: 4
Perception more positive among shoppers under 40 vs. over 40 and in males vs. females.
PRICING
SCORE: +1
PRIORITY RATING: 3
Positive perception driven by shoppers under 40.
DF EXCLUSIVES
SCORE: -6
PRIORITY RATING: 2
Weaker perceptions among shoppers over 40 and females.
PROMOTIONS
SCORE: -7
PRIORITY RATING: 1
Negative perception driven by shoppers over 40.
Base: Alcohol Shoppers (356); Attribute perception scores calculated vs. category perception average, weakest perception = highest priority
© Counter Intelligence Retail Ltd www.counterintelligenceretail.com 148
ON-LAND STORES ON-BOARD STORES
