
Page 59 - North American & Caribbean Cruise Traveller
P. 59
Industry Insider:
North American & Caribbean Cruise Duty & Tax Free Retail 2015
5.2.2.1 STEADY PERFORMERS: SHOPPING ENVIRONMENT
Overall, 7 in 10 on-land shoppers rated the shopping environment as ‘excellent’ or ‘good’, whereas a slightly lower proportion, 64%, gave the same ratings for the shopping environment on-board, indicating that the retail environment on-land is currently more effectively meeting shopper expectations.
SHOPPING ENVIRONMENT PRIORITY RATING: 2
Providing pleasant and attractive surroundings where shoppers want to relax and spend time browsing is crucial to encouraging more extensive consideration of the store offers, giving shoppers plenty of opportunity for trading up and browsing categories they consider to be lower priority. Furthermore, the shopping environment is key when looking to drive sales within high value categories such as Watches & Jewellery and Fashion & Accessories. It is therefore important to prioritise the shopping environment of these categories with activities such as observing jewellery or watch making to drive perceptions of luxury as well as perceptions of quality and craftsmanship.
On-board retailers should also look to drive more positive perceptions of the shopping environment on more luxury services through bespoke shopper-based activities, such as closed store experiences at off-peak times. This could be complimented with personal shopping experiences during normal store opening hours through offering customers a trained staff member. On less premium services, ensure a very relaxed shopping environment, encouraging shoppers to browse at their own pace.
ON-BOARD...
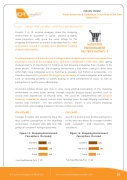
Younger travellers and Americans have the most positive perceptions of the shopping environment on-board, with 42% and 32% giving an ‘excellent’ rating respectively.
Figure 15: Shopping Environment Perceptions: On-board
ON-LAND...
As with on-board stores, positive perceptions of this area are driven by younger travellers (46% ‘excellent’) and Americans (35% ‘excellent’).
Figure 16: Shopping Environment Perceptions: On-land
Excellent Very Good Good Poor/Very/Extremely Poor
30% 34%
34% 2%
Excellent Very Good Good Poor/Very/Extremely Poor
32% 38%
27% 3%
© Counter Intelligence Retail Ltd www.counterintelligenceretail.com
59
