
Page 54 - AnnualEducationReport2018-19
P. 54
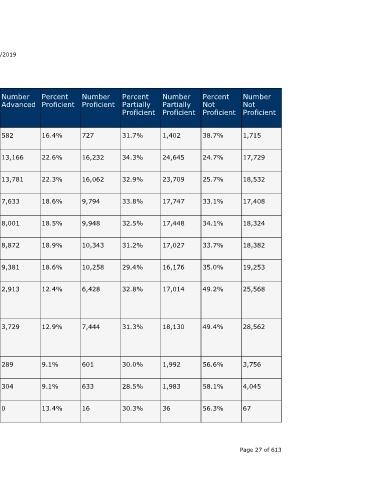
Number  Not  Proficient  1,715  17,729  18,532  17,408  18,324  18,382  19,253  25,568  28,562  3,756  4,045  67    Page 27 of 613


                                  Percent  Not  Proficient  38.7%  24.7%  25.7%  33.1%  34.1%  33.7%  35.0%  49.2%  49.4%  56.6%  58.1%  56.3%


                                  Number  Partially  Proficient  1,402  24,645  23,709  17,747  17,448  17,027  16,176  17,014  18,130  1,992  1,983  36


                                  Percent  Partially  Proficient  31.7%  34.3%  32.9%  33.8%  32.5%  31.2%  29.4%  32.8%  31.3%  30.0%  28.5%  30.3%


                                  Number  Proficient  727  16,232  16,062  9,794  9,948  10,343  10,258  6,428  7,444     601    633    16


                                  Percent  Proficient  16.4%  22.6%  22.3%  18.6%  18.5%  18.9%  18.6%  12.4%  12.9%      9.1%   9.1%   13.4%


                    04/10/2019    Number  Advanced  582  13,166  13,781  7,633  8,001  8,872  9,381  2,913    3,729       289    304    0


                                  Percent  Advanced  13.1%  18.3%  19.1%  14.5%  14.9%  16.2%  17.0%  5.6%    6.4%        4.4%   4.4%   0.0%


                                  State  Number  Students  Proficient  1,309  29,398  29,843  17,427  17,949  19,215  19,639  9,341  11,173  890  937  16


                                  State  Percent  Students  Proficient  29.6%  41.0%  41.4%  33.1%  33.4%  35.2%  35.7%  18.0%  19.3%  13.4%  13.5%  13.4%
                        Annual Education Report Statewide


                                  School  Year  2017-18  2016-17  2017-18  2016-17  2017-18  2016-17  2017-18  2016-17  2017-18  2016-17  2017-18  2016-17


                                  Testing  Group  Two or  More Races  White  White  Female  Female  Male  Male  Economicall  y  Disadvanta  ged  Economicall  y  Disadvanta  ged  English  Learners  English  Learners  Migrant  A service of the Center for Educational Performance and Information (CEPI)


                             M-STEP Grades 3-11  Grade  Subject  6th Grade Mathematic  Content  s  6th Grade Mathematic  Content  s  6th Grade Mathematic  Content  s  6th Grade Mathematic  Content  s  6th Grade Mathematic  Content  s  6th Grade Mathematic  Content  s  6th Grade Mathematic  Content  s  6th Grade Mathematic  Content  s  6th Grade Mathematic  Content  s  6th Grade Mathematic  Content  s  6th Grade Mathematic  Content  s  6th Grade Mathematic  Content  s