
Page 52 - AnnualEducationReport2018-19
P. 52
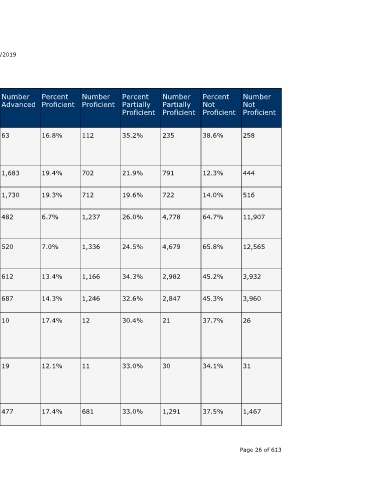
Number  Not  Proficient  258  444  516  11,907   12,565    3,932  3,960   26             31             1,467       Page 26 of 613


                                  Percent  Not  Proficient  38.6%  12.3%  14.0%  64.7%  65.8%  45.2%  45.3%  37.7%         34.1%          37.5%


                                  Number  Partially  Proficient  235  791  722  4,778  4,679  2,982  2,847  21             30             1,291


                                  Percent  Partially  Proficient  35.2%  21.9%  19.6%  26.0%  24.5%  34.3%  32.6%  30.4%   33.0%          33.0%


                                  Number  Proficient  112  702    712    1,237     1,336     1,166  1,246   12             11             681


                                  Percent  Proficient  16.8%  19.4%  19.3%  6.7%   7.0%      13.4%  14.3%   17.4%          12.1%          17.4%


                    04/10/2019    Number  Advanced  63     1,683  1,730  482       520       612    687     10             19             477


                                  Percent  Advanced  9.4%  46.5%  47.0%  2.6%      2.7%      7.0%   7.9%    14.5%          20.9%          12.2%


                                  State  Number  Students  Proficient  175  2,385  2,442  1,719  1,856  1,778  1,933  22   30             1,158


                                  State  Percent  Students  Proficient  26.2%  65.9%  66.4%  9.3%  9.7%  20.5%  22.1%  31.9%  33.0%       29.6%
                        Annual Education Report Statewide


                                  School  Year  2017-18    2016-17  2017-18  2016-17  2017-18  2016-17  2017-18  2016-17   2017-18        2016-17


                                  Testing  Group  American  Indian or  Alaska  Native  Asian  Asian  Black or  African  American  Black or  African  American  Hispanic of  Any Race  Hispanic of  Any Race  Native  Hawaiian  or Other  Pacific  Islander  Native  Hawaiian  or Other  Pacific  Islander  Two or  More Races A service of the Center for Educational Performance and Information (CEPI)


                             M-STEP Grades 3-11  Grade  Subject  6th Grade Mathematic  Content  s  6th Grade Mathematic  Content  s  6th Grade Mathematic  Content  s  6th Grade Mathematic  Content  s  6th Grade Mathematic  Content  s  6th Grade Mathematic  Content  s  6th Grade Mathematic  Content  s  6th Grade Mathematic  Content  s  6th Grade Mathematic  Content  s  6th Grade Mathematic  Content  s