
Page 47 - AnnualEducationReport2018-19
P. 47
04/10/2019 Number Percent Number Percent Number Percent Number Not Not Partially Partially Proficient Proficient Advanced Proficient Proficient Proficient Proficient 33 35.9% 27 29.3% 15 16.3% 17 1,683 39.0% 1,357 31.5% 673 15.6% 601 1,925 42.5% 1,256 27.7% 726 16.0% 621 18,817 26.2% 22,561 31.4% 16,028 22.3% 14,427 20,185 28.1% 21,977 30.6% 15,268 21.3% 14,387 18,997 35.5% 17,105 31.9% 9,574 17.9% 7,898 20,198 37.8% 16,427 30.8% 9,160 17.2% 7,612 19,104 34.9% 15,168 27.7% 10,362 18.9% 10,078 20,394 36.6% 14,609 26.2% 10,199 18.3% 10,458
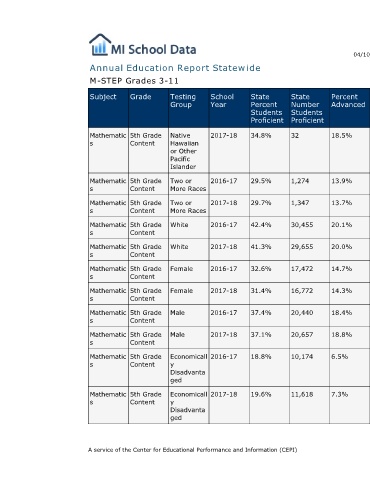
Percent Advanced 18.5% 13.9% 13.7% 20.1% 20.0% 14.7% 14.3% 18.4% 18.8% 6.5% 7.3%
State Number Students Proficient 32 1,274 1,347 30,455 29,655 17,472 16,772 20,440 20,657 10,174 11,618
State Percent Students Proficient 34.8% 29.5% 29.7% 42.4% 41.3% 32.6% 31.4% 37.4% 37.1% 18.8% 19.6%
Annual Education Report Statewide
School Year 2017-18 2016-17 2017-18 2016-17 2017-18 2016-17 2017-18 2016-17 2017-18 2016-17 2017-18
Testing Group Native Hawaiian or Other Pacific Islander Two or More Races Two or More Races White White Female Female Male Male Economicall y Disadvanta ged Economicall y Disadvanta ged A service of the Center for Educational Performance and Information (CEPI)
M-STEP Grades 3-11 Grade Subject 5th Grade Mathematic Content s 5th Grade Mathematic Content s 5th Grade Mathematic Content s 5th Grade Mathematic Content s 5th Grade Mathematic Content s 5th Grade Mathematic Content s 5th Grade Mathematic Content s 5th Grade Mathematic Content s 5th Grade Mathematic Content s 5th Grade Mathematic Content s 5th Grade Mathematic Content s