
Page 1025 - AnnualEducationReport2018-19
P. 1025
04/10/2019 Reason for Accountabili Overall EL General School Identificatio ty Status Index Value Participation Participation Quality/Stu n Index Value Index Value dent Success Index Value N/A N/A 83.41 100.00 100.00 89.44 N/A N/A 84.76 N/A 100.00 93.12 N/A N/A 75.93 N/A 100.00 83.87 N/A N/A 82.35 N/A 100.00 94.01 N/A N/A 92.22 100.00 100.00 91.59 N/A N/A 91.81 N/A 100.00 81.52 N/A N/A 87.13 N/A 100.00 86.00 N/A N/A N/A N/A N/A N/A N/A N/A 73.45 N/A 100.00 86.04 Page 516 of 613
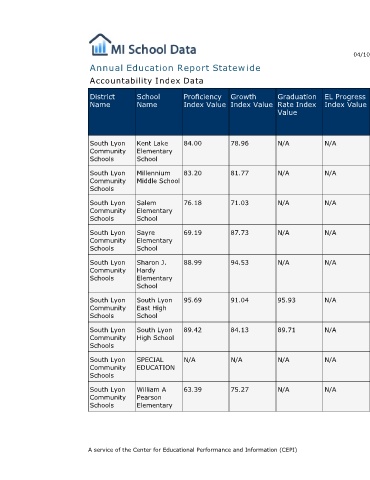
EL Progress Index Value N/A N/A N/A N/A N/A N/A N/A N/A N/A
Graduation Rate Index Value N/A N/A N/A N/A N/A 95.93 89.71 N/A N/A
Annual Education Report Statewide
Growth Index Value 78.96 81.77 71.03 87.73 94.53 91.04 84.13 N/A 75.27
Proficiency Index Value 84.00 83.20 76.18 69.19 88.99 95.69 89.42 N/A 63.39 A service of the Center for Educational Performance and Information (CEPI)
Accountability Index Data
School Name Kent Lake Elementary School Millennium Middle School Salem Elementary School Sayre Elementary School Sharon J. Hardy Elementary School South Lyon East High School South Lyon High School SPECIAL EDUCATION William A Pearson Elementary
District Name South Lyon Community Schools South Lyon Community Schools South Lyon Community Schools South Lyon Community Schools South Lyon Community Schools South Lyon Community Schools South Lyon Community Schools South Lyon Community Schools South Lyon Community Schools