
Page 1029 - AnnualEducationReport2018-19
P. 1029
04/10/2019 Reason for Accountabili Overall EL General School Identificatio ty Status Index Value Participation Participation Quality/Stu n Index Value Index Value dent Success Index Value N/A N/A 73.38 N/A 100.00 80.19 N/A N/A 66.51 N/A 100.00 91.03 N/A N/A 60.11 N/A 100.00 81.61 N/A N/A 41.95 N/A 100.00 78.40 N/A N/A 1.35 N/A N/A 7.43 N/A N/A N/A N/A N/A N/A N/A N/A 37.09 N/A 100.00 59.11 N/A N/A 34.86 N/A N/A 36.08 N/A N/A 75.44 N/A 100.00 98.17 Page 518 of 613
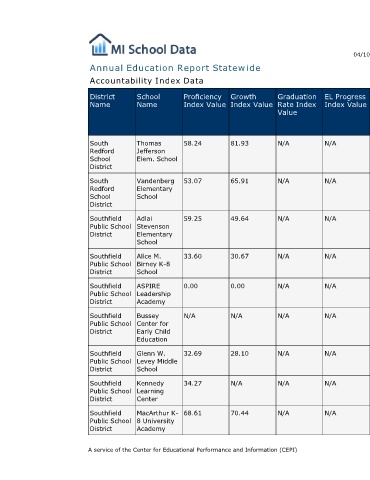
EL Progress Index Value N/A N/A N/A N/A N/A N/A N/A N/A N/A
Graduation Rate Index Value N/A N/A N/A N/A N/A N/A N/A N/A N/A
Annual Education Report Statewide
Growth Index Value 81.93 65.91 49.64 30.67 0.00 N/A 28.10 N/A 70.44
Proficiency Index Value 58.24 53.07 59.25 33.60 0.00 N/A 32.69 34.27 68.61 A service of the Center for Educational Performance and Information (CEPI)
Accountability Index Data
School Name Thomas Jefferson Elem. School Vandenberg Elementary School Adlai Stevenson Elementary School Alice M. Birney K-8 School ASPIRE Leadership Academy Bussey Center for Early Child Education Glenn W. Levey Middle School Kennedy Learning Center MacArthur K- 8 University Academy
District Name South Redford School District South Redford School District Southfield Public School District Southfield Public School District Southfield Public School District Southfield Public School District Southfield Public School District Southfield Public School District Southfield Public School District