
Page 194 - AnnualEducationReport2018-19
P. 194
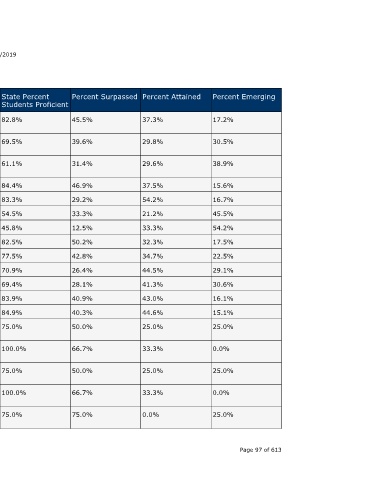
Percent Emerging  17.2%  30.5%  38.9%  15.6%  16.7%  45.5%  54.2%  17.5%  22.5%  29.1%  30.6%  16.1%  15.1%  25.0%  0.0%  25.0%  0.0%  25.0%  Page 97 of 613


                                  Percent Attained  37.3%  29.8%  29.6%  37.5%  54.2%  21.2%  33.3%  32.3%  34.7%  44.5%  41.3%  43.0%  44.6%  25.0%  33.3%  25.0%  33.3%  0.0%


                                  Percent Surpassed  45.5%  39.6%  31.4%  46.9%  29.2%  33.3%  12.5%  50.2%  42.8%  26.4%  28.1%  40.9%  40.3%  50.0%  66.7%  50.0%  66.7%  75.0%


                                  State Percent Students Proficient                                                  100.0%        100.0%


                    04/10/2019           82.8%  69.5%   61.1%  84.4%  83.3%  54.5%  45.8%  82.5%  77.5%  70.9%  69.4%  83.9%  84.9%  75.0%  75.0%  75.0%


                                  School Year  2017-18  2016-17  2017-18  2016-17  2017-18  2016-17  2017-18  2016-17  2017-18  2016-17  2017-18  2016-17  2017-18  2016-17  2017-18  2016-17  2017-18  2016-17


                                  Testing Group  Economically  Disadvantaged  Economically  Disadvantaged  Economically  Disadvantaged  English Learners  English Learners  English Learners  English Learners  All Students  All Students  All Students  All Students  All Students  All Students  American Indian or  Alaska Native  American Indian or  Alaska Native  American Indian or  Alaska Native  American Indian or  Alaska Native  American Indian or  Alaska Native


                        Annual Education Report Statewide

                             MI-Access Supported Independence


                                         6th Grade Content  6th Grade Content  6th Grade Content  6th Grade Content  6th Grade Content  6th Grade Content  6th Grade Content  7th Grade Content  7th Grade Content  7th Grade Content  7th Grade Content  7th Grade Content  7th Grade Content  7th Grade Content  7th Grade Content  7th Grade Content  7th Grade Content  7th Grade Content A service of the Center for Educational Performance and Information (CEPI)


                                  Grade


                                  Subject  ELA  Mathematics  Mathematics  ELA  ELA  Mathematics  Mathematics  ELA  ELA  Mathematics  Mathematics  Science  Science  ELA  ELA  Mathematics  Mathematics  Science