
Page 347 - AnnualEducationReport2018-19
P. 347
04/10/2019 Reason for Accountabili Overall EL General School Identificatio ty Status Index Value Participation Participation Quality/Stu n Index Value Index Value dent Success Index Value N/A N/A 79.23 N/A 100.00 80.14 N/A N/A 71.52 N/A 100.00 71.99 N/A N/A 59.60 N/A 100.00 75.56 N/A N/A 79.15 N/A 99.83 89.10 N/A N/A 62.77 N/A 99.96 77.38 N/A N/A 89.53 N/A 100.00 92.14 N/A N/A N/A N/A N/A N/A N/A N/A 87.06 N/A 100.00 87.72 Page 177 of 613
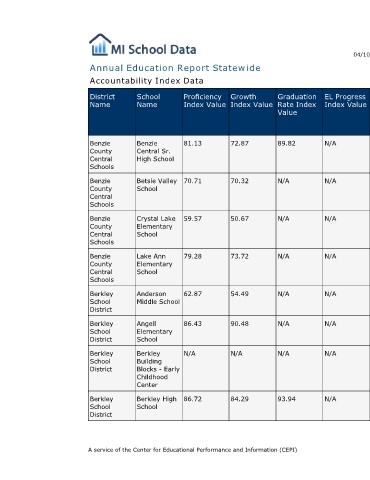
EL Progress Index Value N/A N/A N/A N/A N/A N/A N/A N/A
Graduation Rate Index Value 89.82 N/A N/A N/A N/A N/A N/A 93.94
Annual Education Report Statewide
Growth Index Value 72.87 70.32 50.67 73.72 54.49 90.48 N/A 84.29
Proficiency Index Value 81.13 70.71 59.57 79.28 62.87 86.43 N/A 86.72 A service of the Center for Educational Performance and Information (CEPI)
Accountability Index Data
School Name Benzie Central Sr. High School Betsie Valley School Crystal Lake Elementary School Lake Ann Elementary School Anderson Middle School Angell Elementary School Berkley Building Blocks - Early Childhood Center Berkley High School
District Name Benzie County Central Schools Benzie County Central Schools Benzie County Central Schools Benzie County Central Schools Berkley School District Berkley School District Berkley School District Berkley School District