
Page 349 - AnnualEducationReport2018-19
P. 349
04/10/2019 Reason for Accountabili Overall EL General School Identificatio ty Status Index Value Participation Participation Quality/Stu n Index Value Index Value dent Success Index Value N/A N/A 98.33 N/A 100.00 90.55 N/A N/A 78.17 100.00 100.00 92.58 N/A N/A 97.48 N/A 100.00 88.72 N/A N/A 98.56 N/A 100.00 95.98 N/A N/A 72.63 N/A N/A 88.58 N/A N/A 0.00 N/A N/A 0.00 N/A N/A 92.32 N/A 100.00 58.34 N/A N/A N/A N/A N/A N/A N/A N/A 59.07 N/A 100.00 51.32 Page 178 of 613
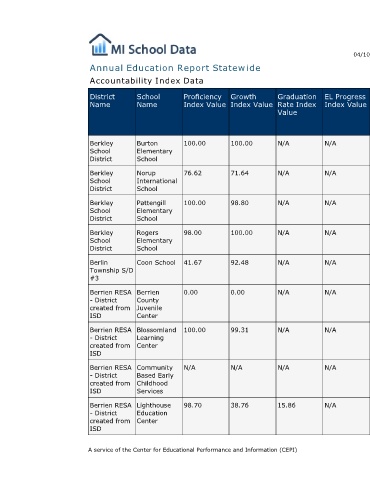
EL Progress Index Value N/A N/A N/A N/A N/A N/A N/A N/A N/A
Graduation Rate Index Value N/A N/A N/A N/A N/A N/A N/A N/A 15.86
Annual Education Report Statewide
Growth Index Value 100.00 71.64 98.80 100.00 92.48 0.00 99.31 N/A 38.76
Proficiency Index Value 100.00 76.62 100.00 98.00 41.67 0.00 100.00 N/A 98.70 A service of the Center for Educational Performance and Information (CEPI)
Accountability Index Data
School Name Burton Elementary School Norup International School Pattengill Elementary School Rogers Elementary School Coon School Berrien County Juvenile Center Blossomland Learning Center Community Based Early Childhood Services Lighthouse Education Center
District Name Berkley School District Berkley School District Berkley School District Berkley School District Berlin Township S/D #3 Berrien RESA - District created from ISD Berrien RESA - District created from ISD Berrien RESA - District created from ISD Berrien RESA - District created from ISD