
Page 375 - AnnualEducationReport2018-19
P. 375
04/10/2019 Reason for Accountabili Overall EL General School Identificatio ty Status Index Value Participation Participation Quality/Stu n Index Value Index Value dent Success Index Value N/A N/A 45.03 N/A 100.00 65.48 N/A N/A 49.57 N/A N/A 49.57 N/A N/A 97.08 N/A 100.00 94.68 N/A N/A 99.46 N/A 100.00 96.54 N/A N/A 86.24 N/A 100.00 95.25 N/A N/A 27.00 N/A 98.68 21.68 N/A N/A 89.49 N/A 100.00 91.69 N/A N/A 94.75 N/A 99.81 97.43 N/A N/A 99.79 N/A 100.00 98.83 Page 191 of 613
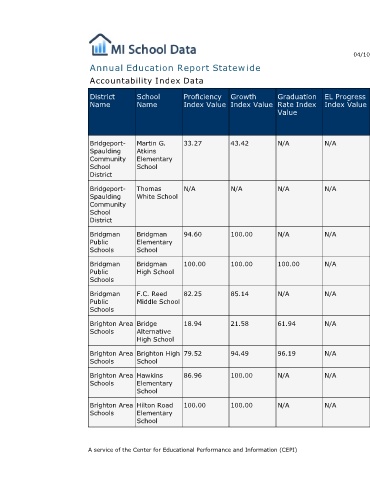
EL Progress Index Value N/A N/A N/A N/A N/A N/A N/A N/A N/A
Graduation Rate Index Value N/A N/A N/A 100.00 N/A 61.94 96.19 N/A N/A
Annual Education Report Statewide
Growth Index Value 43.42 N/A 100.00 100.00 85.14 21.58 94.49 100.00 100.00
Proficiency Index Value 33.27 N/A 94.60 100.00 82.25 18.94 79.52 86.96 100.00 A service of the Center for Educational Performance and Information (CEPI)
Accountability Index Data
School Name Martin G. Atkins Elementary School Thomas White School Bridgman Elementary School Bridgman High School F.C. Reed Middle School Bridge Alternative High School Brighton High School Hawkins Elementary School Hilton Road Elementary School
District Name Bridgeport- Spaulding Community School District Bridgeport- Spaulding Community School District Bridgman Public Schools Bridgman Public Schools Bridgman Public Schools Brighton Area Schools Brighton Area Schools Brighton Area Schools Brighton Area Schools