
Page 377 - AnnualEducationReport2018-19
P. 377
04/10/2019 Reason for Accountabili Overall EL General School Identificatio ty Status Index Value Participation Participation Quality/Stu n Index Value Index Value dent Success Index Value N/A N/A 92.24 N/A 100.00 95.73 N/A N/A 87.68 N/A 100.00 95.73 N/A N/A N/A N/A N/A N/A N/A N/A 85.41 N/A 100.00 91.77 N/A N/A 97.68 N/A 100.00 96.26 N/A N/A 73.84 N/A 100.00 73.68 N/A N/A 61.97 N/A 100.00 79.40 N/A N/A 76.48 N/A 100.00 82.73 N/A N/A 70.35 N/A 100.00 76.41 Page 192 of 613
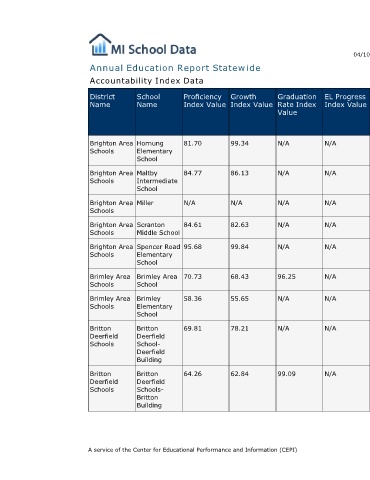
EL Progress Index Value N/A N/A N/A N/A N/A N/A N/A N/A N/A
Graduation Rate Index Value N/A N/A N/A N/A N/A 96.25 N/A N/A 99.09
Annual Education Report Statewide
Growth Index Value 99.34 86.13 N/A 82.63 99.84 68.43 55.65 78.21 62.84
Proficiency Index Value 81.70 84.77 N/A 84.61 95.68 70.73 58.36 69.81 64.26 A service of the Center for Educational Performance and Information (CEPI)
Accountability Index Data
School Name Hornung Elementary School Maltby Intermediate School Miller Scranton Middle School Spencer Road Elementary School Brimley Area School Brimley Elementary School Britton Deerfield School- Deerfield Building Britton Deerfield Schools- Britton Building
District Name Brighton Area Schools Brighton Area Schools Brighton Area Schools Brighton Area Schools Brighton Area Schools Brimley Area Schools Brimley Area Schools Britton Deerfield Schools Britton Deerfield Schools