
Page 463 - AnnualEducationReport2018-19
P. 463
04/10/2019 Reason for Accountabili Overall EL General School Identificatio ty Status Index Value Participation Participation Quality/Stu n Index Value Index Value dent Success Index Value N/A N/A 96.40 N/A 100.00 79.69 N/A N/A 76.39 100.00 100.00 81.80 N/A N/A 84.99 100.00 100.00 84.19 N/A N/A 72.57 100.00 100.00 77.82 N/A N/A 91.16 100.00 100.00 91.49 Underperfor Targeted 55.12 100.00 99.85 78.83 ming Group, Support and All Improvement Components (25th %ile) N/A N/A 93.45 95.98 100.00 97.18 N/A N/A 87.73 N/A 100.00 81.16 N/A N/A 75.70 N/A
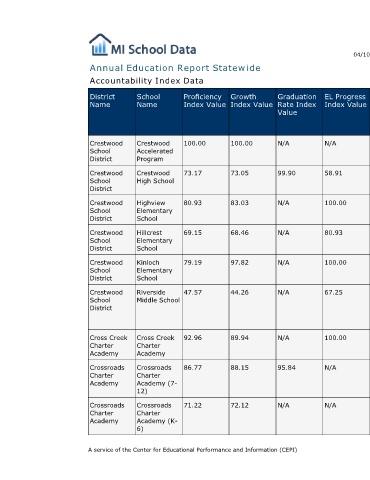
EL Progress Index Value N/A 58.91 100.00 80.93 100.00 67.25 100.00 N/A N/A
Graduation Rate Index Value N/A 99.90 N/A N/A N/A N/A N/A 95.84 N/A
Annual Education Report Statewide
Growth Index Value 100.00 73.05 83.03 68.46 97.82 44.26 89.94 88.15 72.12
Proficiency Index Value 100.00 73.17 80.93 69.15 79.19 47.57 92.96 86.77 71.22 A service of the Center for Educational Performance and Information (CEPI)
Accountability Index Data
School Name Crestwood Accelerated Program Crestwood High School Highview Elementary School Hillcrest Elementary School Kinloch Elementary School Riverside Middle School Cross Creek Charter Academy Crossroads Charter Academy (7- 12) Crossroads Charter Academy (K- 6)
District Name Crestwood School District Crestwood School District Crestwood School District Crestwood School District Crestwood School District Crestwood School District Cross Creek Charter Academy Crossroads Charter Academy Crossroads Charter Academy