
Page 901 - AnnualEducationReport2018-19
P. 901
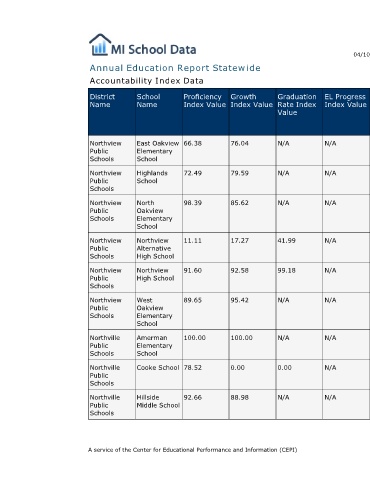
04/10/2019     Reason for Accountabili  Overall  EL General  School  Identificatio ty Status Index Value Participation Participation Quality/Stu  n Index Value Index Value  dent  Success  Index Value  N/A  N/A  76.71  N/A  100.00  96.41  N/A  N/A  80.06  N/A  99.76  94.09  N/A  N/A  91.97  N/A 100.00  92.93  N/A  N/A  18.28  N/A  N/A  18.70  N/A  N/A  91.97  N/A  100.00  84.93  N/A  N/A  93.23  N/A  100.00  94.34  N/A  N/A  99.02  N/A  100.00  94.47  N/A  N/A  33.99  N/A  97.47  39.57  N/A  N/A  91.93  98.24  100.00  95.97  Page 454 of 613
                                  EL Progress  Index Value  N/A  N/A  N/A        N/A       N/A       N/A         N/A       N/A       N/A


                                  Graduation  Rate Index  Value  N/A  N/A  N/A   41.99     99.18     N/A         N/A       0.00      N/A


                        Annual Education Report Statewide
                                  Growth  Index Value  76.04  79.59  85.62       17.27     92.58     95.42       100.00    0.00      88.98


                                  Proficiency  Index Value  66.38  72.49  98.39  11.11     91.60     89.65       100.00    78.52     92.66            A service of the Center for Educational Performance and Information (CEPI)

                             Accountability Index Data


                                  School  Name   East Oakview  Elementary  School  Highlands  School  North  Oakview  Elementary  School  Northview  Alternative  High School  Northview  High School  West  Oakview  Elementary  School  Amerman  Elementary  School  Cooke School  Hillside  Middle School


                                  District  Name  Northview  Public  Schools  Northview  Public  Schools  Northview  Public  Schools  Northview  Public  Schools  Northview  Public  Schools  Northview  Public  Schools  Northville  Public  Schools  Northville  Public  Schools  Northville  Public  Schools