
Page 903 - AnnualEducationReport2018-19
P. 903
04/10/2019 Reason for Accountabili Overall EL General School Identificatio ty Status Index Value Participation Participation Quality/Stu n Index Value Index Value dent Success Index Value N/A N/A 93.38 N/A 100.00 96.64 N/A N/A 99.40 100.00 100.00 96.55 N/A N/A 95.99 100.00 100.00 91.93 N/A N/A N/A N/A N/A N/A N/A N/A 98.77 100.00 100.00 96.11 N/A N/A 95.73 100.00 100.00 97.49 N/A N/A 99.31 100.00 100.00 95.54 N/A N/A 99.34 100.00 100.00 96.22 N/A N/A 14.16 N/A N/A 20.70 Page 455 of 613
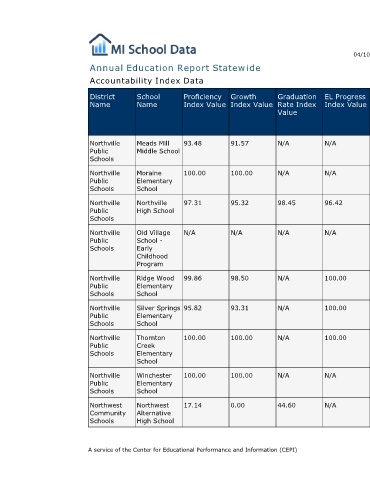
EL Progress Index Value N/A N/A 96.42 N/A 100.00 100.00 100.00 N/A N/A
Graduation Rate Index Value N/A N/A 98.45 N/A N/A N/A N/A N/A 44.60
Annual Education Report Statewide
Growth Index Value 91.57 100.00 95.32 N/A 98.50 93.31 100.00 100.00 0.00
Proficiency Index Value 93.48 100.00 97.31 N/A 99.86 95.82 100.00 100.00 17.14 A service of the Center for Educational Performance and Information (CEPI)
Accountability Index Data
School Name Meads Mill Middle School Moraine Elementary School Northville High School Old Village School - Early Childhood Program Ridge Wood Elementary School Silver Springs Elementary School Thornton Creek Elementary School Winchester Elementary School Northwest Alternative High School
District Name Northville Public Schools Northville Public Schools Northville Public Schools Northville Public Schools Northville Public Schools Northville Public Schools Northville Public Schools Northville Public Schools Northwest Community Schools