
Page 84 - How to Write and Publish a Scientific Paper, 8th Edition 8th Edition
P. 84
Page 70
do we decide which is preferable? This is often a difficult decision. A good rule might be this: If the data show
pronounced trends, making an interesting picture, use a graph. If the numbers just sit there, with no exciting trend in
evidence, a table should be satisfactory (and certainly easier and cheaper for you to prepare). Tables are also preferred
for presenting exact numbers.
Page 72
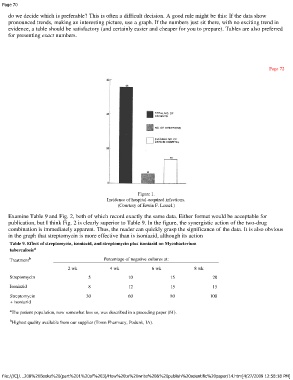
Figure 1.
Incidence of hospital-acquired infections.
(Courtesy of Erwin F. Lessel.)
Examine Table 9 and Fig. 2, both of which record exactly the same data. Either format would be acceptable for
publication, but I think Fig. 2 is clearly superior to Table 9. In the figure, the synergistic action of the two-drug
combination is immediately apparent. Thus, the reader can quickly grasp the significance of the data. It is also obvious
in the graph that streptomycin is more effective than is isoniazid, although its action
Table 9. Effect of streptomycin, isoniazid, and streptomycin plus isoniazid on Mycobacterium
a
tuberculosis
Treatment b Percentage of negative cultures at:
2 wk 4 wk 6 wk 8 wk
Streptomycin 5 10 15 20
Isoniazid 8 12 15 15
Streptomycin 30 60 80 100
+ isoniazid
a The patient population, now somewhat less so, was described in a preceding paper (61).
b Highest quality available from our supplier (Town Pharmacy, Podunk, IA).
file:///C|/...208%20Books%20(part%201%20of%203)/How%20to%20write%20&%20publish%20scientific%20paper/14.htm[4/27/2009 12:58:18 PM]