
Page 87 - How to Write and Publish a Scientific Paper, 8th Edition 8th Edition
P. 87
Page 70
Do not extend the ordinate or the abscissa (or the explanatory lettering) beyond what the graph demands. For
example, if your data points range between 0 and 78, your topmost index number should be 80. You might feel a
tendency to extend the graph to 100, a nice round number; this urge is especially difficult to resist if the data points
are percentages, for which the natural range is 0 to 100. You must resist this urge, however. If you do not, parts of
your graph will be empty; worse, the live part of your graph will then be restricted in dimension, because you have
wasted perhaps 20% or more of the width (or height) with empty white space.
Page 76
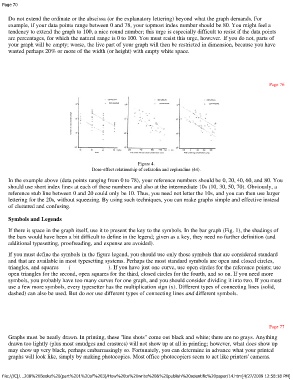
Figure 4.
Dose-effect relationship of cefazolin and cephradine (44).
In the example above (data points ranging from 0 to 78), your reference numbers should be 0, 20, 40, 60, and 80. You
should use short index lines at each of these numbers and also at the intermediate 10s (10, 30, 50, 70). Obviously, a
reference stub line between 0 and 20 could only be 10. Thus, you need not letter the 10s, and you can then use larger
lettering for the 20s, without squeezing. By using such techniques, you can make graphs simple and effective instead
of cluttered and confusing.
Symbols and Legends
If there is space in the graph itself, use it to present the key to the symbols. In the bar graph (Fig. 1), the shadings of
the bars would have been a bit difficult to define in the legend; given as a key, they need no further definition (and
additional typesetting, proofreading, and expense are avoided).
If you must define the symbols in the figure legend, you should use only those symbols that are considered standard
and that are available in most typesetting systems. Perhaps the most standard symbols are open and closed circles,
triangles, and squares ( ). If you have just one curve, use open circles for the reference points; use
open triangles for the second, open squares for the third, closed circles for the fourth, and so on. If you need more
symbols, you probably have too many curves for one graph, and you should consider dividing it into two. If you must
use a few more symbols, every typesetter has the multiplication sign (x). Different types of connecting lines (solid,
dashed) can also be used. But do not use different types of connecting lines and different symbols.
Page 77
Graphs must be neatly drawn. In printing, these ''line shots" come out black and white; there are no grays. Anything
drawn too lightly (plus most smudges and erasures) will not show up at all in printing; however, what does show up
may show up very black, perhaps embarrassingly so. Fortunately, you can determine in advance what your printed
graphs will look like, simply by making photocopies. Most office photocopiers seem to act like printers' cameras.
file:///C|/...208%20Books%20(part%201%20of%203)/How%20to%20write%20&%20publish%20scientific%20paper/14.htm[4/27/2009 12:58:18 PM]