Page 29 - 74321_NSAA_SpringJournal_Web
P. 29

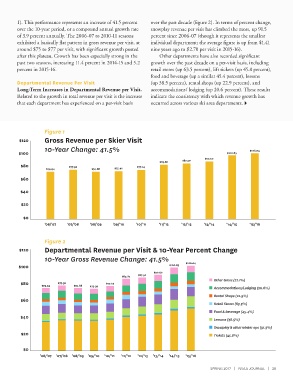
1). This performance represents an increase of 41.5 percent   over the past decade (figure 2). In terms of percent change,
              over the 10-year period, or a compound annual growth rate   snowplay revenue per visit has climbed the most, up 91.5
              of 3.9 percent annually. The 2006-07 to 2010-11 seasons   percent since 2006-07 (though it represents the smallest
              exhibited a basically flat pattern in gross revenue per visit, at   individual department; the average figure is up from $1.41
              around $75 to $77 per visit, with significant growth posted   nine years ago to $2.70 per visit in 2015-16).
              after this plateau. Growth has been especially strong in the   Other departments have also recorded significant
              past two seasons, increasing 11.4 percent in 2014-15 and 5.2   growth over the past decade on a per-visit basis, including
              percent in 2015-16.                                    retail stores (up 63.5 percent), lift tickets (up 45.8 percent),
                                                                     food and beverage (up a similar 45.4 percent), lessons
              Departmental Revenue Per Visit                         (up 38.5 percent), rental shops (up 22.9 percent), and
              Long-Term Increases in Departmental Revenue per Visit.   accommodations/ lodging (up 20.6 percent). These results
              Related to the growth in total revenue per visit is the increase   indicate the consistency with which revenue growth has
              that each department has experienced on a per-visit basis   occurred across various ski area departments.


                         Figure 1
              $120       Gross Revenue per Skier Visit
                         10-Year Change: 41.5%                                                                 $106.04
              $100                                                                                   $100.85
                                                                                            $90.50
                                                                         $85.88    $87.50
               $80                 $77.56                       $77.24
                          $74.94             $74.68   $75.41
               $60


               $40

               $20

                $0
                         ’06/’07   ’07/’08  ’08/’09   ’09/’10  ’10/’11   ’11/’12  ’12/’13   ’13/’14  ’14/’15   ’15/’16


                         Figure 2

              $120       Departmental Revenue per Visit & 10-Year Percent Change
                         10-Year Gross Revenue Change: 41.5%
              $100                                                           $100.85  $106.04
                                                                       $90.50
                                                         $85.87  $87.50
                                                                                                Other Gross (22.1%)
               $80      $74.94  $77.56  $74.68     $77.23
                                            $73.99
                                                                                                Accommodations/Lodging (20.6%)
                                                                                                Rental Shops (22.9%)
               $60
                                                                                                Retail Stores (63.5%)
                                                                                                Food & beverage (45.4%)
               $40
                                                                                                Lessons (38.5%)
                                                                                                Snowplay & other winter ops (91.5%)
               $20                                                                              Tickets (45.8%)


                $0
                       ’06/’07  ’07/’08  ’08/’09  ’09/’10  ’10/’11  ’11/’12  ’12/’13  ’13/’14  ’14/’15  ’15/’16

                                                                                              SPRING 2017  |  NSAA JOURNAL  |  29
   24   25   26   27   28   29   30   31   32   33   34