
Page 123 - AR DPBM-2016--SMALL
P. 123
Analisis & Pembahasan Manajemen Tata Kelola Dana Pensiun Laporan Keuangan Konsolidasi
Management Discussion & Analysis Good Pension Fund Governance Consolidated Financial Report
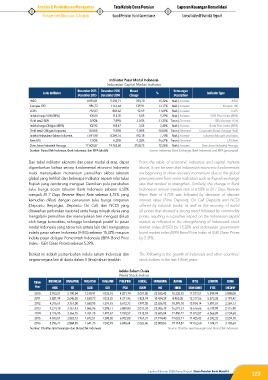
Indikator Pasar Modal Indonesia
Indonesian Capital Market Indicator
Desember 2015 Desember 2016 Mutasi Keterangan
Jenis Indikator % Indicator Type
December 2015 December 2016 Change Description
IHSG 4.593,01 5.296,71 703,70 15,32% Naik | Increase IHSG
Kompas 100 986,73 1116,64 129,91 13,17% Naik | Increase Kompas 100
LQ45 792,03 884,62 92,59 11,69% Naik | Increase LQ45
Indeks harga SUN (IBPA) 108,50 114,35 5,85 5,39% Naik | Increase SUN Price Index (IBPA)
Yield rata2 SBN 8,90% 7,89% -1,01% -11,35% Turun | Decrease SBN Average Yield
Indeks harga Obligasi (IBPA) 102,92 105,47 2,55 2,48% Naik | Increase Bond Price Index (IBPA)
Yield rata2 Obligasi Korporasi 10,56% 9,50% -1,06% -10,04% Turun | Decrease Corporate Bonds Average Yield
Indeks Reksadana Saham Infovesta 7.691,98 8.284,16 592,18 7,70% Naik | Increase Infovesta Mutual Fund Index
Rate LPS 7,50% 6,25% -1,25% -16,67% Turun | Decrease LPS Rate
Dow Jones Industrial Average 17.603,87 19.762,60 2158,73 12,26% Naik | Increase Dow Jones Industrial Average
Sumber: Bursa Efek Indonesia, Bank Indonesia, dan IBPA (diolah) Source: Indonesia Stock Exchange, Bank Indonesia, and IBPA (processed)
Dari tabel indikator ekonomi dan pasar modal di atas, dapat From the table of economic indicators and capital markets
digambarkan bahwa secara fundamental ekonomi Indonesia above, it can be seen that Indonesia’s economic fundamentals
mulai menunjukkan momentum pemulihan akibat tekanan are beginning to show recovery momentum due to the global
global yang terlihat dari beberapa indikator seperti nilai tukar pressures seen from some indicators such as Rupiah exchange
Rupiah yang cenderung menguat. Demikian pula perubahan rate that tended to strengthen. Similarly, the change in Bank
suku bunga acuan tahunan Bank Indonesia sebesar 6,50% Indonesia’s annual interest rate of 6.50% to BI 7 Days Reverse
menjadi BI 7 Days Reverse Repo Rate sebesar 4,75% yang Repo Rate of 4.75% was followed by decrease of deposit
kemudian diikuti dengan penurunan suku bunga simpanan interest rates (Time Deposits, On Call Deposits and NCD)
(Deposito Berjangka, Deposito On Call, dan NCD) yang offered by national banks; as well as the recovery of world
ditawarkan perbankan nasional; serta harga minyak dunia yang oil prices that showed a strong trend followed by commodity
mengalami pemulihan dan menunjukkan tren menguat diikuti prices, resulting in a positive impact on the Indonesian capital
oleh harga komoditas, sehingga berdampak positif ke pasar market as reflected in the strengthening of Indonesia’s stock
modal Indonesia yang tercermin antara lain dari menguatnya market index (IHSG) by 15.32% and Indonesian government
indeks pasar saham Indonesia (IHSG) sebesar 15,32% maupun bond market index (IBPA Bond Price Index of IGBI Clean Prices
indeks pasar obligasi Pemerintah Indonesia (IBPA Bond Price by 5.39%.
Index - IGBI Clean Prices) sebesar 5,39%.
Berikut ini adalah pertumbuhan indeks saham Indonesia dan The following is the growth of Indonesia and other countries’
negara-negara lain di dunia dalam 5 (lima) tahun terakhir: stock indices in the last 5 (five) years:
Indeks Saham Dunia
World Stock Indices
Tahun INDONESIA SINAGPORE MALAYSIA THAILAND PHILIPINA KORSEL HONGKONG JEPANG NYSE LONDON CHINA
Year IHSG STI KLSE SETI PSEI KOSPI HIS NIKEI DOW JONES FTSE SHCOMP
2010 3.703,51 3.190,04 1.518,91 1.032,76 4.201,14 2.051,00 23.035,45 10.228,92 11.577,51 5.899,94 2.808,08
2011 3.821,99 2.645,35 1.530,73 1.025,32 4.371,96 1.825,74 18.434,39 8.455,35 12.217,56 5.572,28 2.199,42
2012 4.316,67 3.167,08 1.688,95 1.391,93 5.812,73 1.997,05 22.656,92 10.395,18 13.104,14 5.897,81 2.269,13
2013 4.274,18 3.167,43 1.866,96 1.298,71 5.889,83 2.011,34 23.306,39 16.291,31 16.576,66 6.749,09 2.115,98
2014 5.226,95 3.366,15 1.761,25 1.497,67 7.230,57 1.915,59 23.605,04 17.450,77 17.823,07 6.566,09 3.234,68
2015 4.593,01 2.882,73 1.692,51 1.288,02 6.952,08 1.961,31 21.914,40 19.033,71 17.425,03 6.242,32 3.539,18
2016 5.296,71 2.884,93 1.641,73 1.542,93 6.840,64 2.026,46 22.000,56 19.114,37 19.762,60 7.104,71 3.103,64
Sumber: Otoritas Jasa Keuangan dan Bursa Efek Indonesia Source: Otoritas Jasa Keuangan and Bursa Efek Indonesia
Laporan Tahunan 2016 Annual Report | Dana Pensiun Bank Mandiri
123