
Page 124 - AR DPBM-2016--SMALL
P. 124
Ikhtisar Utama Laporan Manajemen Profil Dana Pensiun Bank Mandiri
Key Financial Highlights Management Report Dana Pensiun Bank Mandiri Profile
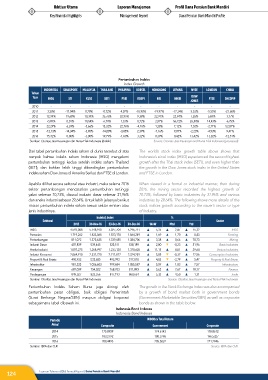
Pertumbuhan Indeks
Index Growth
INDONESIA SINAGPORE MALAYSIA THAILAND PHILIPINA KORSEL HONGKONG JEPANG NYSE LONDON CHINA
Tahun
Year IHSG STI KLSE SETI PSEI KOSPI HIS NIKEI DOW FTSE SHCOMP
JONES
2010 - - - - - - - - - - -
2011 3,20% -17,04% 0,78% -0,72% 4,07% -10,98% -19,97% -17,34% 5,53% -5,55% -21,68%
2012 12,94% 19,68% 10,34% 35,76% 32,95% 9,38% 22,91% 22,94% 7,26% 5,84% 3,17%
2013 -0,98% 0,01% 10,54% -6,70% 1,33% 0,72% 2,87% 56,72% 26,50% 14,43% -6,75%
2014 22,29% 6,24% -5,66% 15,32% 22,76% -4,76% 1,28% 7,12% 7,52% -2,71% 52,87%
2015 -12,13% -14,34% -3,90% -14,00% -3,85% 2,39% -7,16% 9,07% -2,23% -4,93% 9,41%
2016 15,32% 0,08% -3,00% 19,79% -1,60% 3,32% 0,39% 0,42% 13,42% 13,82% -12,31%
Sumber: Otoritas Jasa Keuangan dan Bursa Efek Indonesia (diolah) Source: Otoritas Jasa Keuangan and Bursa Efek Indonesia (processed)
Dari tabel pertumbuhan Indeks saham di dunia tersebut di atas The world’s stock index growth table above shows that
nampak bahwa indeks saham Indonesia (IHSG) mengalami Indonesia’s stock index (IHSG) experienced the second highest
pertumbuhan tertinggi kedua setelah indeks saham Thailand growth after the Thai stock index (SETI), and even higher than
(SETI), dan bahkan lebih tinggi dibandingkan pertumbuhan the growth in the Dow Jones stock index in the United States
indeks saham Dow Jones di Amerika Serikat dan FTSE di London. and FTSE in London.
Apabila dilihat secara sektoral atau industri, maka selama 2016 When viewed in a formal or industrial manner, then during
sektor pertambangan mencatatkan pertumbuhan tertinggi 2016, the mining sector recorded the highest growth of
yakni sebesar 70,73%, disusul industri dasar sebesar 31,96% 70.73%, followed by basic industries by 31.96% and various
dan aneka industri sebesar 29,64%. Untuk lebih jelasnya berikut industries by 29.64%. The following shows more details of the
rincian pertumbuhan indeks saham sesuai sektor emiten atau stock indices growth according to the issuer’s sector or type
jenis industrinya. of industry.
Indeks | Index %
Sektoral Sector
2015 30-Nov-16 23-Dec-16 30-Dec-16 WoW Mtd Ytd
IHSG 4.593,008 5.148,910 5.027,704 5.296,711 5,35 2,87 15,32 IHSG
Pertanian 1.719,262 1.833,068 1.833,178 1.864,249 1,69 1,70 8,43 Farming
Pertambangan 811,072 1.375,635 1.339,455 1.384,706 3,38 0,66 70,73 Mining
Industri Dasar 407,839 539,445 523,511 538,189 2,80 -0,23 31,96 Basic Industries
Aneka Industri 1.057,275 1.268,997 1.233,120 1.370,628 11,15 8,01 29,64 Various Industries
Industri Konsumsi 2.064,910 2.331,720 2.211,817 2.324,281 5,08 -0,32 12,56 Consumption Industries
Properti & Real Estate 490,933 532,685 493,993 517,810 4,82 -2,79 5,47 Property & Real Estate
Infrastruktur 981,333 1.036,603 999,684 1.055,587 5,59 1,83 7,57 Infrastructure
Keuangan 687,039 754,022 768,703 811,893 5,62 7,67 18,17 Finance
Perdagangan 849,527 823,556 817,193 860,654 5,32 4,50 1,31 Trade
Sumber: Otoritas Jasa Keuangan dan Bursa Efek Indonesia Source: Otoritas Jasa Keuangan and Bursa Efek Indonesia
Pertumbuhan Indeks Saham Bursa juga diiringi oleh The growth in the Stock Exchange Index was also accompanied
pertumbuhan pasar obligasi, baik obligasi Pemerintah by a growth of bond market both in government bonds
(Surat Berharga Negara/SBN) maupun obligasi korporasi (Government Marketable Securities/SBN) as well as corporate
sebagaimana tabel dibawah ini. bonds as shown in the table below.
Indonesia Bond Indexes
Indonesia Bond Indexes
Periode INDOBex Total Return
Priod Composite Government Corporate
2014 175.8939 174.6143 178.8612
2015 183.2792 180.3796 196.5327
2016 208.4493 205.5032 221.2946
Sumber: IBPA dan OJK Source: IBPA dan OJK
124 Laporan Tahunan 2016 Annual Report | Dana Pensiun Bank Mandiri