Page 349 - NUMINO_WB_5B
P. 349
188-B4-1
The Stem-Leaf Graph
1. Answer the questions.
Example
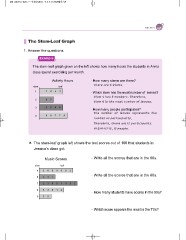
The stem-leaf graph given on the left shows how many hours the students in Ann’s
class spend exercising per month.
Activity Hours How many stems are there?
Which stem has the most number of leaves?
stem leaf
1 1854
2 87
3 3548 How many people participated?
4 80779
a. The stem-leaf graph left shows the test scores out of 100 that students in
Jessica’s class got.
Music Scores Write all the scores that are in the 60s.
Write all the scores that are in the 80s.
stem leaf How many students have scores in the 50s?
5 2609803
6 547
7 23851422
8 53012
9 35
Which score appears the most in the 70s?


