Page 350 - NUMINO_WB_5B
P. 350
188-B4-2
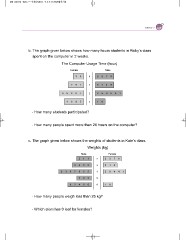
b. The graph given below shows how many hours students in Ricky’s class
spent on the computer in 2 weeks.
The Computer Usage Time (hour)
Female Male
36 0 2978
291 1 5348
46887 2 258661
4695 3 16
How many students participated?
How many people spent more than 26 hours on the computer?
c. The graph given below shows the weights of students in Kate’s class.
Weights (kg)
Male Female
211 2 2378
9400 3 012
2357955 4 20441
785 5
02450 6 16
How many people weigh less than 25 kg?
Which stem has 0 leaf for females?


