Page 360 - NUMINO_WB_5B
P. 360
188-P2-2
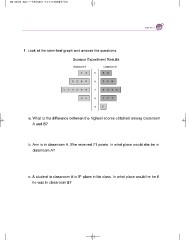
1. Look at the stem-leaf graph and answer the questions.
Science Experiment Results
Classroom A Classroom B
13 5 58
0248 6 358
113369 7 0448
25 8 177
95
a. What is the difference between the highest scores obtained among classroom
A and B?
b. Ann is in classroom A. She received 71 points. In what place would she be in
classroom A?
c. A student in classroom A is 9th place in his class. In what place would he be if
he was in classroom B?


