Page 361 - NUMINO_WB_5B
P. 361
188-P3-1Temperature ( °C)
Temperature (°C)Use of Line Graph
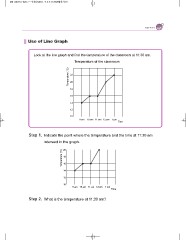
Look at the line graph and find the temperature of the classroom at 11:30 am.
Temperature of the classroom
22
20
18
16
14
12
10
9 am 10 am 11 am 12 pm 1 pm
Time
Step 1. Indicate the point where the temperature and the time at 11:30 am
intersect in the graph.
20
18
16
14
12
10
9 am 10 am 11 am 12 pm 1 pm
Time
Step 2. What is the temperature at 11:30 am?


