Page 165 - TB_5B
P. 165
Height(cm)I mode (page 146, Unit 32)
interval (page 134, Unit 31) The number that appears the most.
The difference between the 2 numbers next N
to each other on the scale of a graph.
numerical data (page 132, Unit 31)
like terms (page 129, Unit 30)
Data that includes numbers and can be
The terms that have the same variable, arranged numerically.
raised to the same power.
4a and 2a are like terms. O
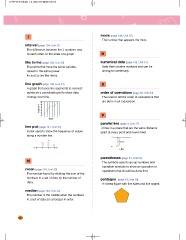
line graph (page 138, Unit 31) order of operations (page 60, Unit 23)
A graph that uses line segments to connect The rules to tell the order of calculations that
points on a coordinate grid to show data are done in an expression.
change over time.
P
10
8 parallel line (page 4, Unit 17)
6
4 2 lines in a plane that are the same distance
2 apart at every point and never meet.
0 123456
Week l
distance
line plot (page 141, Unit 32)
m
A plot used to show the frequency of values lm
along a number line.
parentheses (page 61, Unit 23)
M
The symbols used to group numbers and
mean (page 146, Unit 32) operation symbols to show an operation or
operations that should be done first.
The number found by dividing the sum of the
numbers in a set of data by the number of pentagon (page 16, Unit 18)
data.
A closed figure with five sides and five angles.
median (page 146, Unit 32)
The number in the middle when the numbers
in a set of data are arranged in order.
154
interval (page 134, Unit 31) The number that appears the most.
The difference between the 2 numbers next N
to each other on the scale of a graph.
numerical data (page 132, Unit 31)
like terms (page 129, Unit 30)
Data that includes numbers and can be
The terms that have the same variable, arranged numerically.
raised to the same power.
4a and 2a are like terms. O
line graph (page 138, Unit 31) order of operations (page 60, Unit 23)
A graph that uses line segments to connect The rules to tell the order of calculations that
points on a coordinate grid to show data are done in an expression.
change over time.
P
10
8 parallel line (page 4, Unit 17)
6
4 2 lines in a plane that are the same distance
2 apart at every point and never meet.
0 123456
Week l
distance
line plot (page 141, Unit 32)
m
A plot used to show the frequency of values lm
along a number line.
parentheses (page 61, Unit 23)
M
The symbols used to group numbers and
mean (page 146, Unit 32) operation symbols to show an operation or
operations that should be done first.
The number found by dividing the sum of the
numbers in a set of data by the number of pentagon (page 16, Unit 18)
data.
A closed figure with five sides and five angles.
median (page 146, Unit 32)
The number in the middle when the numbers
in a set of data are arranged in order.
154