Page 160 - TB_5B
P. 160
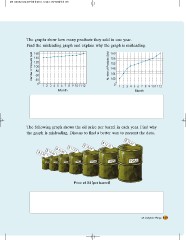
The graphs show how many products they sold in one year.
Find the misleading graph and explain why the graph is misleading.
Number of Products Sold 160
Number of Products Sold 156
160 152
140 148
120 144
100 140
80 0 1 2 3 4 5 6 7 8 9 10 11 12
60 Month
40
0 1 2 3 4 5 6 7 8 9 10 11 12
Month
The following graph shows the oil price per barrel in each year. Find why
the graph is misleading. Discuss to find a better way to present the data.
$ 2.41 $ 10.46 $ 10.85 $ 11.51 $ 12.09 $ 12.70 $ 13.31
1980 1981 1982 1983 1984 1985 1986
Price of Oil (per barrel)
32. Compare Things 149