Page 156 - TB_5B
P. 156
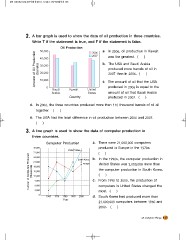
2 . A bar graph is used to show the data of oil production in three countries.
Write T if the statement is true, and F if the statement is false.
Oil Production 2006 a . In 2006, oil production in Kuwait
Amount of Oil Production 50,000 2007 was the greatest. ( )
(barrels) 40,000
30,000 b. The USA and Saudi Arabia
20,000
produced more barrels of oil in
2007 than in 2006. ( )
10,000 Kuwait United c. The amount of oil that the USA
Country States
0 produced in 2006 is equal to the
Saudi
Arabia amount of oil that Saudi Arabia
produced in 2007. ( )
d. In 2006, the three countries produced more than 110 thousand barrels of oil all
together. ( )
e. The USA had the least difference in oil production between 2006 and 2007.
()
3 . A line graph is used to show the data of computer production in
three countries.
30,000 Computer Production a. There were 21,000,000 computers
27,000
24,000 United States produced in Europe in the 1970s.
21,000
Number of Computers Produced 18,000 ()
(Thousands) 15,000
12,000 South Korea b . In the 1990s, the computer production in
9,000 Europe United States was 3,000,000 more than
the computer production in South Korea.
()
c. From 1990 to 2000, the production of
6,000 1960 1970 1980 1990 2000 computers in United States changed the
3,000
Year most. ( )
0
d. South Korea had produced more than
21,000,000 computers between 1960 and
2000. ( )
32. Compare Things 145