Page 155 - TB_5B
P. 155
Activity 2 True or False
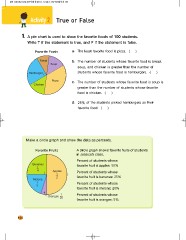
1 . A pie chart is used to show the favorite foods of 100 students.
Write T if the statement is true, and F if the statement is false.
Favorite Foods a. The least favorite food is pizza. ( )
Bread b. The number of students whose favorite food is bread,
Soup
soup, and chicken is greater than the number of
Hamburger Pizza students whose favorite food is hamburgers. ( )
Chicken
c. The number of students whose favorite food is soup is
greater than the number of students whose favorite
food is chicken. ( )
d. 25 of the students picked hamburgers as their
favorite food. ( )
Make a circle graph and show the data as percents.
Favorite Fruits A circle graph shows favorite fruits of students
in Jessica’s class.
Bananas Apples
_1 Percent of students whose
4 _1 favorite fruit is apples: 50%
2
Melons Percent of students whose
_1 favorite fruit is bananas: 25%
5
Percent of students whose
Oranges _1 favorite fruit is melons: 20%
20
Percent of students whose
favorite fruit is oranges: 5%
144