Page 153 - TB_5B
P. 153
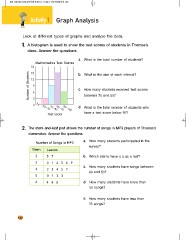
Activity 1 Graph Analysis
Look at different types of graphs and analyze the data.
1 . A histogram is used to show the test scores of students in Thomas’s
class. Answer the questions.
a. What is the total number of students?
Mathematics Test Scores
18
Number of Students 15 b. What is the size of each interval?
12
9
c. How many students received test scores
6
between 70 and 80?
3
0 60-70 70-8080-9090-100 d. What is the total number of students who
Test score have a test score below 90?
2 . The stem and leaf plot shows the number of songs in MP3 players of Thomas’s
classmates. Answer the questions.
Number of Songs in MP3 a. How many students participated in the
Stem Leaves survey?
2 57
3 012569 b. Which stems have a 0 as a leaf?
4 23457
5 0133 c. How many students have songs between
6 488
40 and 50?
d. How many students have more than
50 songs?
e. How many students have less than
35 songs?
142