Page 148 - TB_5B
P. 148
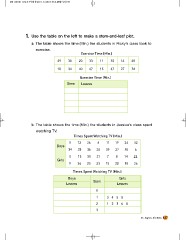
1 . Use the table on the left to make a stem-and-leaf plot.
a. The table shows the time (Min.) the students in Ricky’s class took to
exercise.
Exercise Time (Min.)
49 38 20 33 11 35 14 48
18 34 40 47 15 47 27 36
Stem Exercise Time (Min.)
Leaves
1
2 1458
3 07
4 34568
07789
b. The table shows the time (Min.) the students in Jessica’s class spent
watching TV.
Times Spent Watching TV (Min.)
3 12 26 6 11 19 24 32
Boys
34 28 36 28 39 27 35 6
Girls 0 13 31 21 7 8 14 22
9 36 33 23 15 28 18 26
Times Spent Watching TV (Min.)
Boys Stem Girls
Leaves Leaves
366 0 0789
129 1 3458
46788 2 12368
24569 3 136
31. Express the Data 137