Page 145 - TB_5B
P. 145
Activity 2 Histograms
Learn about histograms.
A histogram is a bar graph that shows the frequency of data
within a certain interval.
The tally chart shows the number of books that the students in Ann’s
class read in one year. Use the data to make a histogram.
Number of Books Read in 1 Year
1 5 9 13 17
2 6 10 14 18
3 7 11 15 19
4 8 12 16 20
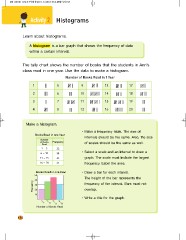
Make a histogram.
Books Read in one Year Make a frequency table. The size of
intervals should be the same. Also, the size
Number Frequency of scales should be the same as well.
of Books
22 Select a scale and an interval to draw a
Read 38 graph. The scale must include the largest
45 frequency. Label the axes.
15 31
Draw a bar for each interval.
6 10 The height of the bar represents the
frequency of the interval. Bars must not
11 15 overlap.
16 20 Write a title for the graph.
Frequency Books Read in one Year
50
40
30
20
10
20
16
15
11
10
6
5
1
Number of Books Read
134
Learn about histograms.
A histogram is a bar graph that shows the frequency of data
within a certain interval.
The tally chart shows the number of books that the students in Ann’s
class read in one year. Use the data to make a histogram.
Number of Books Read in 1 Year
1 5 9 13 17
2 6 10 14 18
3 7 11 15 19
4 8 12 16 20
Make a histogram.
Books Read in one Year Make a frequency table. The size of
intervals should be the same. Also, the size
Number Frequency of scales should be the same as well.
of Books
22 Select a scale and an interval to draw a
Read 38 graph. The scale must include the largest
45 frequency. Label the axes.
15 31
Draw a bar for each interval.
6 10 The height of the bar represents the
frequency of the interval. Bars must not
11 15 overlap.
16 20 Write a title for the graph.
Frequency Books Read in one Year
50
40
30
20
10
20
16
15
11
10
6
5
1
Number of Books Read
134