Page 149 - TB_5B
P. 149
Activity 4 Line Graphs
Learn about line graphs.
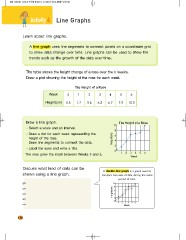
A line graph uses line segments to connect points on a coordinate grid
to show data change over time. Line graphs can be used to show the
trends such as the growth of the data over time.
The table shows the height change of a rose over the 6 weeks.
Draw a plot showing the height of the rose for each week.
Week The Height of a Rose 56
01234 7.0 10.0
Height(cm) 0.5 1.7 3.6 6.2 6.7
Draw a line graph. Height(cm) The Height of a Rose
Select a scale and an interval. 10
8
Draw a dot for each week representing the 6
height of the rose. 4
Draw line segments to connect the dots. 2
0 123456
Label the axes and write a title.
The rose grew the most between Weeks 5 and 6. Week
Discuss what kind of data can be A double-line graph is a graph used to
shown using a line graph. compare two sets of data during the same
period of time.Height(cm)
10
8
6
4
2
0 123456
Week
138
Learn about line graphs.
A line graph uses line segments to connect points on a coordinate grid
to show data change over time. Line graphs can be used to show the
trends such as the growth of the data over time.
The table shows the height change of a rose over the 6 weeks.
Draw a plot showing the height of the rose for each week.
Week The Height of a Rose 56
01234 7.0 10.0
Height(cm) 0.5 1.7 3.6 6.2 6.7
Draw a line graph. Height(cm) The Height of a Rose
Select a scale and an interval. 10
8
Draw a dot for each week representing the 6
height of the rose. 4
Draw line segments to connect the dots. 2
0 123456
Label the axes and write a title.
The rose grew the most between Weeks 5 and 6. Week
Discuss what kind of data can be A double-line graph is a graph used to
shown using a line graph. compare two sets of data during the same
period of time.Height(cm)
10
8
6
4
2
0 123456
Week
138