Page 150 - TB_5B
P. 150
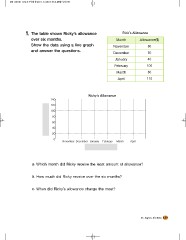
1 . The table shows Ricky’s allowance Rick’s Allowance
over six months. Month Allowance($)
Show the data using a line graph November 80
and answer the questions. December 50
40
January 100
February 80
110
March
April
Ricky’s Allowance
140
120
100
80
60
40
20
0 November December January February March April
a. Which month did Ricky receive the least amount of allowance?
b. How much did Ricky receive over the six months?
c. When did Ricky’s allowance change the most?
31. Express the Data 139