Page 147 - NUMINO TB_3B
P. 147
179_G3U31_G3U22˙—» ¿º 2011.3.23 11:42 AM ˘ ` 136 PDF_In 2540DPI 150LPI T
Activity 1 Make a Bar Graph
1 . Learn about data, graph, and bar graph.
Data is information about people or things.
A graph is the organized drawing that shows sets of data and how they are
related to each other.
A bar graph is the graph that uses bars in different lengths and heights to show
data.
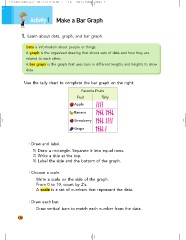
Use the tally chart to complete the bar graph on the right.
Favorite Fruits
Fruit Tally
Apple
Banana
Strawberry
Grape
Draw and label.
1 Draw a rectangle. Separate it into equal rows.
2 Write a title at the top.
3 Label the side and the bottom of the graph.
Choose a scale.
Write a scale on the side of the graph.
From 0 to 10, count by 2’s.
A scale is a set of numbers that represent the data.
Draw each bar.
Draw vertical bars to match each number from the data.
136
Activity 1 Make a Bar Graph
1 . Learn about data, graph, and bar graph.
Data is information about people or things.
A graph is the organized drawing that shows sets of data and how they are
related to each other.
A bar graph is the graph that uses bars in different lengths and heights to show
data.
Use the tally chart to complete the bar graph on the right.
Favorite Fruits
Fruit Tally
Apple
Banana
Strawberry
Grape
Draw and label.
1 Draw a rectangle. Separate it into equal rows.
2 Write a title at the top.
3 Label the side and the bottom of the graph.
Choose a scale.
Write a scale on the side of the graph.
From 0 to 10, count by 2’s.
A scale is a set of numbers that represent the data.
Draw each bar.
Draw vertical bars to match each number from the data.
136